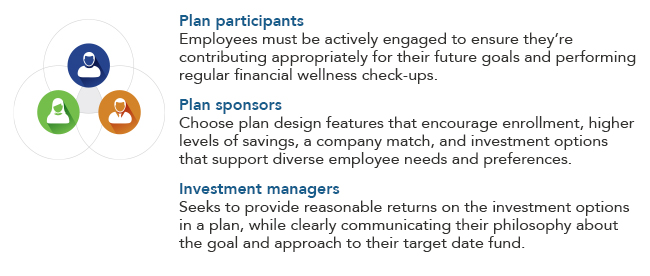
Your benefits strategy should support your long-term workforceplans, which should include helping employees meet their retirementgoals. To do that, it's important to recognize that there are threekey contributors involved in achieving a desired level ofretirement income through a workplace savings plan: the planparticipant (eligible employee), plan sponsor, and the investmentmanager.
|Key contributors to an employee's retirementreadiness:
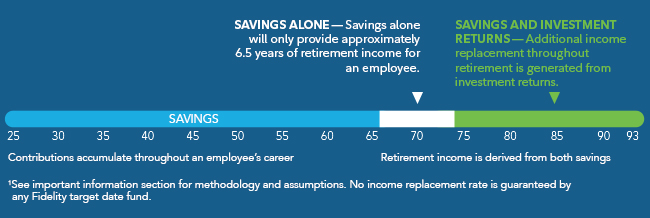
|||The importance of both savings and investmentreturns:
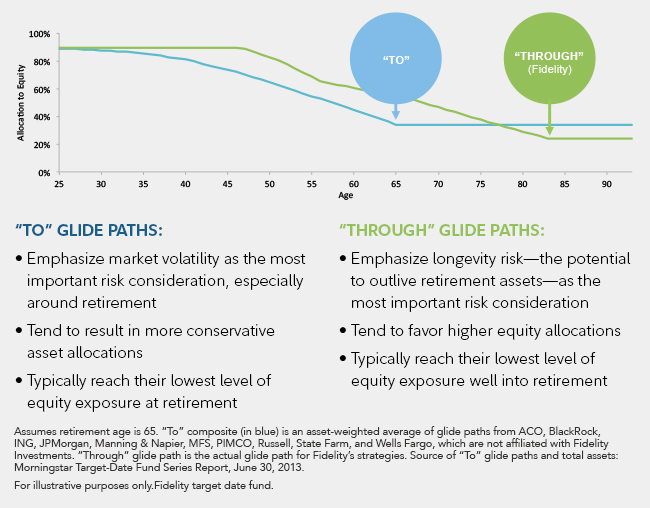
||Employers should consider balancing risks when choosing“to” vs. “through” glide paths:
|In a recent Fidelity study, we compared multiple widely adopteddefined contribution plan designs with varying features toencourage enrollment and saving. We also evaluated the industry'stwo different types of target date funds—those with a glide pathdeveloped to reach its most conservative asset allocation at aspecified retirement date (“to”) and those that will reach theirmost conservative point well into retirement (“through”)—in eachplan design, to determine the impact of each on retirementincome.
||Comparing “to” vs. “through” glide paths
|
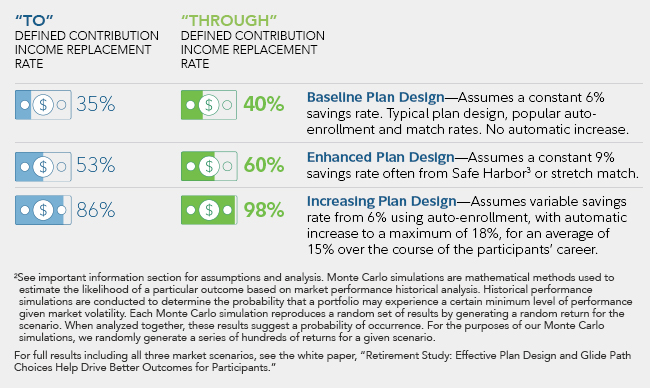
Plandesign scenarios that maximize savings and used a “through” glidepath resulted in higher retirement income replacement:
Our research examined three plan types: Baseline, Enhanced, andIncreasing, in three market scenarios: average, poor, andlower-yielding market forecast. Although each plan design helpsparticipants save for retirement, the ones that offered features tohelp participants boost their savings rates—an auto-enrollmentrate, an annual increase program, and a company match—generatedhigher retirement income when combined with a target date fund witha “through” glide path.
|Average Market ScenarioResults2:
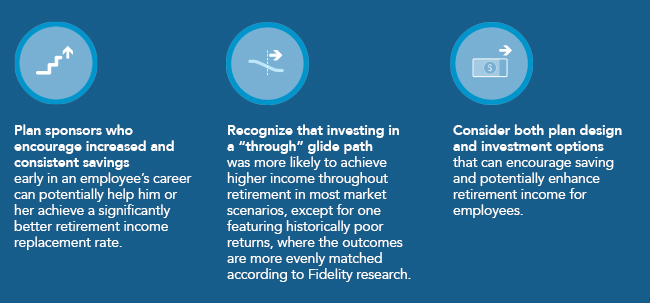
||Key takeaways from the research:
||
Learn more about Fidelity target date funds and the importance ofincome replacement in glide path design. Download charticle now.
Important Information
Investing involvesrisk, including the risk of loss.
Internal rate of return (IRR) is the interest rate at which thenet present value of all the cash flows (both positive andnegative) from a project or investment equal zero.
|1 Chart is a hypothetical example based on a set ofassumptions to illustrate the limits of income replacement that canbe achieved through regular savings contributions alone (whitebar), and the need for an expected return on investment to achievea desired level of income replacement over a longer retirementhorizon (green bar). For the purposes of this chart, the followingassumptions are presumed: investor starts contributing at age 25through age 66, and receives annual salary increases equal to 1.5%over this period. The blue bar represents investor contributionsincreasing from 8% to 13% of salary from age 25 through age 66(includes company matching funds). The white bar represents theexpected income replacement provided solely by the contributionamounts, equal to approximately 50% of one's final preretirementsalary through the early years of retirement. The green barrepresents the expected income replacement needed through a targetdate portfolio's investment returns, equal to approximately 50% ofone's final preretirement salary through age 93. A hypotheticalinternal rate of return (IRR) equal to approximately 4.5% in realterms is assumed (required investment return to have savings equalincome replacement needs). This hypothetical illustration is notintended to predict or project the investment performance of anysecurity or product. The IRR is a rate of return used in capitalbudgeting to measure and compare the profitability of investments.Past performance is no guarantee of future results. Yourperformance will vary, and you may have a gain or loss when yousell your shares. For many investors, these assets will be combinedwith other complementary sources of income (e.g., Social Security,defined benefit plan benefits, and personal savings). Source:Fidelity Investments as of July 1, 2016.
|2 Assumptions used in this analysis – Participant:starting age – 25, retirement age – 67; retirement planning age –93; starting salary – $50,000, final preretirement salary – $92,061(1.5% annual increase). Glide paths: Fidelity's “through” glidepath was used as a proxy for “through” glide paths in themarketplace; the “to” composite benchmark is an asset-weightedcomposite using the top “to” glide paths on Fidelity's WorkplaceInvesting recordkeeping platform as of December 2015, includingAmerican Century, BlackRock, Franklin, John Hancock, JPMorgan, MFS,PIMCO, Putnam, State Farm, and USAA. “To” composite glide path datasourced from Morningstar, Inc., as of April 30, 2016. Plan designsavings assumptions: Baseline – 6%; Enhanced – 9%; Increasing –approximately 15% on average over an investor's full career. Marketreturn environments: average and poor historical markets usehistorical market data from Morningstar for period beginning 1926through Dec. 31, 2015; lower-yielding market returns forecastscenario uses fixed returns of 5.9% for stocks, 1.8% for bonds,0.1% for cash. Stocks (domestic), bonds, and short-term assets(cash) are represented by the S&P 500®, U.S. intermediate-termgovernment bonds, and 30-day U.S. Treasury bills, respectively.Monte Carlo simulation: a mathematical method used to estimate thelikelihood of a particular outcome based on market performancehistorical analysis. Historical performance simulations areconducted to determine the probability that a portfolio mayexperience a certain minimum level of performance given marketvolatility. Each Monte Carlo simulation reproduces a random set ofresults by generating a random return for the scenario. Whenanalyzed together, these results suggest a probability ofoccurrence. For the purposes of our Monte Carlo simulations, werandomly generate a series of hundreds of returns for a givenscenario. Monte Carlo 90% confidence level: means that in 90% ofthe historical market scenarios run, a similar equity glide path,performed at least as well as the results shown. Monte Carlo 50%confidence level: means that in 50% of the historical marketscenarios run, a similar equity glide path, performed at least aswell as results shown and 50% failed to reach the results shown.IMPORTANT: The projections regarding the likelihood of variousinvestment outcomes are hypothetical in nature, do not reflectactual investment results, and are not guarantees of futureresults. Results may vary with each use and over time. The resultsgenerated are based on the assumptions indicated above and are forillustrative plan scenario analysis only; they are not intended foruse by individual investors or plan participants. Source: FidelityInvestments.
|3 100% match of first 3% and 50% match on next2%.
|Target date funds are designed for investors expecting to retirearound the year indicated in each fund's name. The funds aremanaged to gradually become more conservative over time as theyapproach the target date. The investment risk of each targetdate fund changes over time as the fund's asset allocation changes.They are subject to the volatility of the financial markets,including that of equity and fixed income investments in the U.S.and abroad, and may be subject to risks associated with investingin high-yield, small-cap, and foreign securities. Principalinvested is not guaranteed at any time, including at or after thefunds' target dates.
|Target date portfolios are designed to help achieve theretirement objectives of a large percentage of individuals, but thestated objectives may not be entirely applicable to all investorsdue to varying individual circumstances, including retirementsavings plan contribution limitations.
|Fidelity's “through” glide path may differ somewhat from thoseof other target date strategies, which could influence the resultsof the analysis in this article.
|For plan sponsor and institutional use only.
|Fidelity Brokerage Services LLC, Member NYSE, SIPC, 900 SalemStreet, Smithfield, RI 02917
|Fidelity Institutional Services Company, Inc., 500 Salem Street,Smithfield, RI 02917
|© 2016 FMR LLC. All rights reserved.
|768915.2.0
Complete your profile to continue reading and get FREE access to BenefitsPRO, part of your ALM digital membership.
Your access to unlimited BenefitsPRO content isn’t changing.
Once you are an ALM digital member, you’ll receive:
- Critical BenefitsPRO information including cutting edge post-reform success strategies, access to educational webcasts and videos, resources from industry leaders, and informative Newsletters.
- Exclusive discounts on ALM, BenefitsPRO magazine and BenefitsPRO.com events
- Access to other award-winning ALM websites including ThinkAdvisor.com and Law.com
Already have an account? Sign In
© 2024 ALM Global, LLC, All Rights Reserved. Request academic re-use from www.copyright.com. All other uses, submit a request to [email protected]. For more information visit Asset & Logo Licensing.


