
Eastbridge's 2017 Voluntary Participation RatesSpotlight™ report found that just over half of participatingcarriers have seen participation rates increase over the past twoto three years, and the majority expect this trend to continue.While individual carrier responses varied, the overall reportedaverage was 28 percent in 2017, up from 21 percent in 2014.
|So what's driving the increase? And how can you ensure that youare maximizing the revenue potential of each enrollmentopportunity?
|The carriers surveyed point to a variety of factors, includingenhanced marketing materials and decision-support tools, moremandatory enrollments and simpler plan designs.They’re also partnering with brokers who understand the key roleworking conditions play in maximizing enrollment success.
|Our study found participation rates with face-to-face enrollmentmethods average six points higher than methods without a humanelement (i.e., internet enrollments). While all methods have thepotential to generate good participation if well executed, carriersrely on you to negotiate and advocate for the best possibleconditions. In fact, the most frequently reported barriers toachieving better participation levels are a lack of employerengagement and limited employee access.
|The majority of carriers were clear on several ways to maximizeemployee purchases, including:
Requiring all employees to make a yes/no decision
Creating a seamless platform experience so employees can enrollin voluntary products on the same platform as medical products
Sequencing voluntary products alongside core products or, atleast, not at the end of enrollment
If you incorporate these strategies, the result is a win-win-winfor all involved: more compensation for you, more revenue for thecompany, and greater satisfaction for employers. That's great newsfor all involved parties, so long as the proposed enrollmentrequirements actually pay off.
|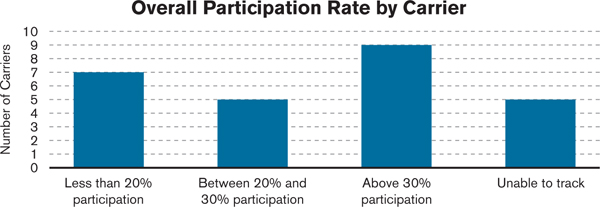
To be confident the enrollment conditions are paying off, it'sessential to measure and monitor results. Most carriers trackoverall participation rate, but have limited capabilities attracking more granular cross-sections like case size, product orenrollment method. Some carriers only track a few products, whileothers track only certain enrollment methods or case sizes.
|Ask your carrier partners what enrollment data they haveavailable and build from there. You may want to consider how yourresults differ if a mandatory enrollment is used over a voluntaryenrollment or the impact of a specific marketing campaign/approach.Once you’ve determined what to track and set up the appropriatereporting structure, you can see trends and changes that willbetter inform conversations with your clients.
|Your proactive effort to set ideal working conditions and toestablish a reporting framework to monitor and measure results mayyield at least two positive outcomes: increased revenue for you andgreater employee satisfaction for the employer.
Complete your profile to continue reading and get FREE access to BenefitsPRO, part of your ALM digital membership.
Your access to unlimited BenefitsPRO content isn’t changing.
Once you are an ALM digital member, you’ll receive:
- Critical BenefitsPRO information including cutting edge post-reform success strategies, access to educational webcasts and videos, resources from industry leaders, and informative Newsletters.
- Exclusive discounts on ALM, BenefitsPRO magazine and BenefitsPRO.com events
- Access to other award-winning ALM websites including ThinkAdvisor.com and Law.com
Already have an account? Sign In
© 2024 ALM Global, LLC, All Rights Reserved. Request academic re-use from www.copyright.com. All other uses, submit a request to [email protected]. For more information visit Asset & Logo Licensing.