
 Termlife was again the top-selling line of voluntary business, followedby accident, short-term disability, dental and critical illness.(Photo: Shutterstock)
This is the last in our series of columns on the voluntary industrysales results for 2017. The first article looked at overallvoluntary sales for the year, while the secondreviewed sales by distribution segment. This column takes a closerlook at sales by product line and platform.
| Bonnie Brazzell and NickRockwell,
Eastbridge Consulting Group, Inc.
Term life was again the top-selling line of business, followedby accident, short-term disability, dental and critical illness.The graph below shows the mix of sales by line ofbusiness.
|Related: Voluntary benefits: How they've become a must-haveproduct for brokers
|Life insurance sales overall were up almost 13 percent in 2017,reaching $2.3 billion. Term accounted for 78 percent of total lifepremium, and sales increased by 14 percent compared to 2016, whileUL/WL sales were up 7 percent this year. By product, 50 percent ofthe UL/WL sales were for universal life products and 50 percentwere for whole life products.
|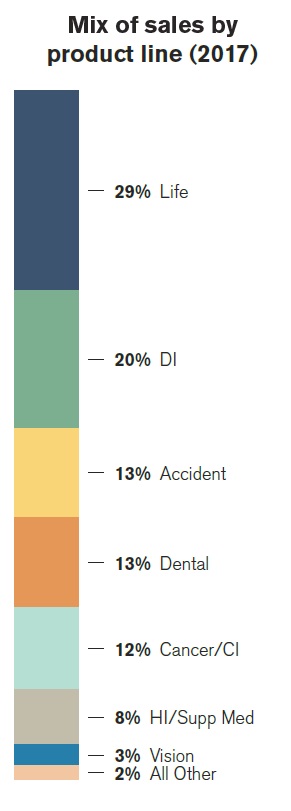 Total disability sales were $1.6billion in 2017. Short-term disability sales continue to representthe majority (67 percent) of disability sales. Both STD and LTDsales increased compared to 2016, at a rate of 7 percent and 4percent, respectively.
The accident product line saw a strong increase in 2017, at arate of almost 12 percent compared to the modest 2 percent increasein 2016. Total accident sales were $1.1 billion.
|Critical illness sales increased 21 percent in 2017 afterincreases of 13 percent in 2016 and a 25 percent increase in 2015.Cancer sales increased by 2 percent in 2017. Critical illness NBAPwas $673 million compared to $341 million for cancer.
|Hospital indemnity, gap and supplemental medical products salesincreased to $646 million in 2017, up 4 percent compared to2016.
|When looking at voluntary sales by product platform, groupproduct sales continued to dominate individual products. The mixfor 2017 was almost 68 percent group and 32 percent individual.Group product sales increased by 5 percent and individual salesincreased by 11 percent compared to 2016.
|The bottom graph shows the results over the past 10 years.
|
The annual U.S. Voluntary/Worksite Sales Report is theindustry's most comprehensive and reliable source of data onvoluntary/worksite sales and inforce premium. This year's studyincludes data from 1997 through 2017 and detailed results for 66carriers. The report is available only to carriers participating inthe survey. For more information about participating in next year'ssurvey, contact us at [email protected].
Complete your profile to continue reading and get FREE access to BenefitsPRO, part of your ALM digital membership.
Your access to unlimited BenefitsPRO content isn’t changing.
Once you are an ALM digital member, you’ll receive:
- Critical BenefitsPRO information including cutting edge post-reform success strategies, access to educational webcasts and videos, resources from industry leaders, and informative Newsletters.
- Exclusive discounts on ALM, BenefitsPRO magazine and BenefitsPRO.com events
- Access to other award-winning ALM websites including ThinkAdvisor.com and Law.com
Already have an account? Sign In
© 2024 ALM Global, LLC, All Rights Reserved. Request academic re-use from www.copyright.com. All other uses, submit a request to [email protected]. For more information visit Asset & Logo Licensing.