
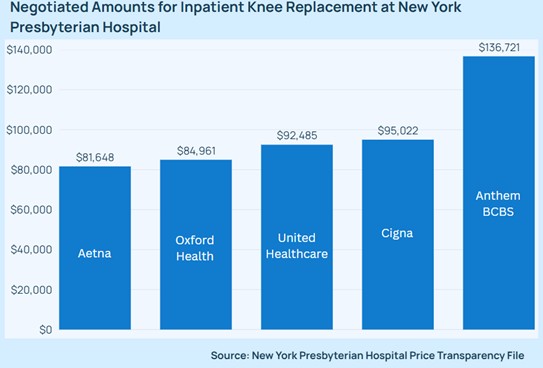
Health care costs jumped 8%-10% for many employers this renewal season — the sharpest increases in years. Yet when advisors and HR leaders try to understand why rates vary so dramatically between carriers, they hit a wall. That's changing. For the first time, massive datasets showing what every major insurer actually pays providers are now publicly available. For example, these datasets can reveal the variation in prices for the same procedure at the same hospital across major payers, allowing advisors and employers to gain new insights into their health care spend. The question is: can we actually use this information to negotiate better rates?
The answer, for now, is complicated. Despite the volume of newly accessible pricing data, many employers continue to make network, contracting and benefit design decisions with limited visibility into true market rates. That's a problem, especially when health care remains one of the largest and fastest-growing expense categories for employers. Over the past decade, employer-sponsored coverage costs have consistently risen faster than general inflation and wages. Yet health care still behaves like a "black box" spend category: generally reviewed once a year at renewal, adjusted incrementally and rarely managed with the same rigor applied to other major operating costs.
Price transparency data available through federal transparency rules can help, but in its raw form, the data is far from what advisors and employers need.
The data exists but it's hard to operationalize
Health pricing data files are massive and technically complex. Individual files can reach hundreds of gigabytes in size, formats vary across issuers, key information is often missing, and completeness and accuracy can vary greatly between payers. In some cases, rates appear for services that providers don't perform, referred to as "ghost rates". Think of a psychiatrist listed as performing a heart surgery, or rates posted for thousands of billing codes that no practice uses. In an analysis published by our team, we found that across major insurers, over 90% of the posted rates were ghost rates, inflating file sizes and making real pricing insights impossible to find without extensive data cleaning. Other times, there are multiple, conflicting prices, listed tax ID numbers that don't match to real practices, or "in-network" providers who live across the country.
Useful insights don't emerge from downloading a file. Raw data must be normalized, validated, cleaned, and benchmarked before it becomes useful. That's where most advisors and employers hit a wall, but it's also where the right partners can make the difference.
Few employers have internal health care analytics teams capable of parsing massive price transparency files and generating market benchmarks. Some may license data from vendors and interpret it themselves, but most will rely on outside advisors, including benefits advisors, third-party administrators (TPAs) or consultants to help.
Benefits advisors should be prepared to answer these questions:
- Where do our rates rank? Can you show me where our network ranks against market rates for our top 10-20 procedures? Are we paying at the 50th percentile? 75th? 90th? Which specific data sources are you using to benchmark our rates?
- How are you using price transparency data in our network design and contract negotiations? How does our rate distribution compare to competitors in our geography?
- If the data shows we're paying above market for certain services, what's your process for renegotiating or identifying lower-cost, high-quality alternatives? How do you help us shift utilization patterns when employees are using higher-cost providers?
- Which transparency data sources are you using? How do you assess data completeness and accuracy, and how often do you refresh these benchmarks?
These conversations shift price transparency from a compliance tool discussion to a performance discussion. They clarify whether price transparency is being actively leveraged or simply used in theory. The goal is not to have pricing data, but to use it to change how health care purchasing and network selection decisions are made.
Even when pricing data is usable, focusing on price alone can be misleading. The lowest negotiated rate doesn't automatically translate into the lowest total cost of care. Advisors and employers must connect pricing to quality, outcomes, site-of-care patterns and utilization behavior. Price transparency data becomes powerful when layered with claims experience, quality metrics, and care navigation.
Three steps to using pricing data this quarter
Getting started with price transparency doesn't have to be daunting.
- Benchmark your top procedures. Start by benchmarking your 25-50 highest-spend services against local market percentiles. Results may point to opportunities for care navigation, direct contracting, or network narrowing.
- Run network comparisons. Model costs under different network configurations to identify where employees need better access versus where narrower networks could cut costs.
- Integrate into renewal strategy. Use these insights in carrier negotiations and benefit design. The expectation isn't perfect data-- it's better-informed decisions that put downward pressure on costs.
With many plans announcing their sharpest rate increases to date, benefits advisors and employers need every tool available to control costs and negotiate more effectively. Price transparency alone won't solve health care cost growth, but it provides the foundational information employers have lacked for decades. The data exists and the tools to analyze it are improving rapidly. The question is whether employers and their advisors will use this moment to fundamentally change how they purchase health care, or whether another renewal cycle will pass with the same limited visibility that's driven costs up year after year.
© Arc, All Rights Reserved. Request academic re-use from www.copyright.com. All other uses, submit a request to TMSalesOperations@arc-network.com. For more information visit Asset & Logo Licensing.