
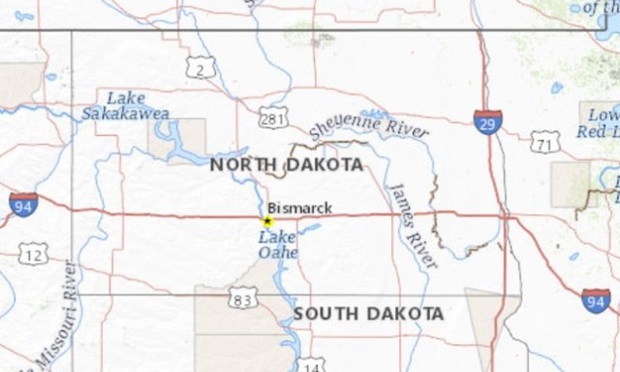

The Upper Midwest states really might be the places to live, overall, for workers who want free time and spending money.
That's what we found when we analyzed a new torrent of U.S. Census Bureau American Community Survey data collected in 2023 to create the 2024 BenefitsPRO Worker Quality-of-Life Index.
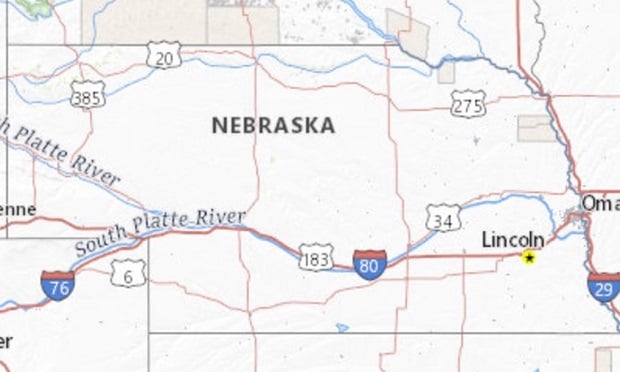
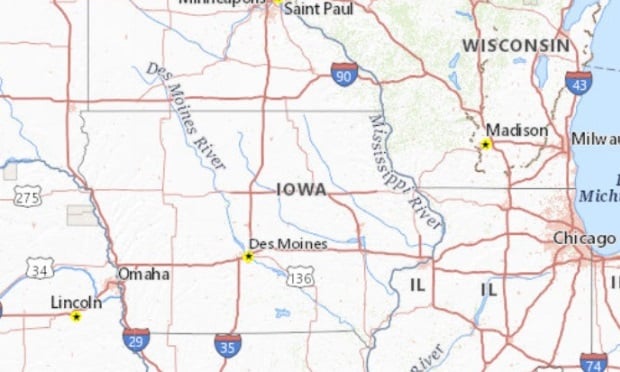
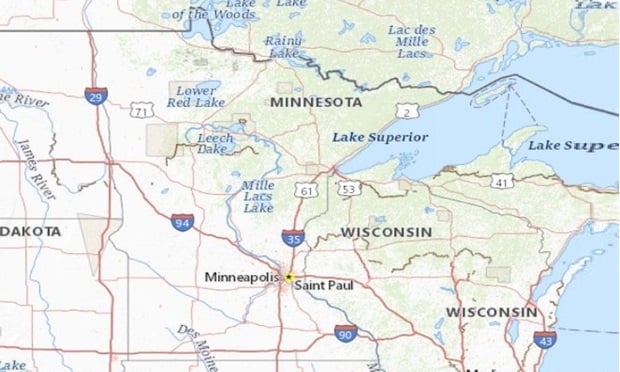
For a look at the 12 states with the best index scores, see the gallery above.
Recommended For You
For data for all 50 states and the District of Columbia, see the table below.
Methods: We created the index by using state-level data for six measures:
- Percentage of workers with a commute under 20 minutes.
- Percentage of renters and mortgage holders with housing costs over 30% of their income.
- Percentage of people who are uninsured.
- Percentage of people ages 26 through 34 with employment-based health insurance (to reflect how likely mid-career professionals, at a similar stage of life, are to have solid group coverage).
- Percentage of people with income below the poverty line.
- Percentage of civilians living outside institutions who have disabilities.
We ranked the states and the District of Columbia for each measure from 1 to 51, with 51 being the best rank and 1 the worst rank.
The index is as an average of the six rankings.
To break ties, we counted the percentage of mid-career workers — people ages 26 through 34 — with employment-based health insurance twice.
Our approach favored states where people can get to work quickly and have spare cash that they might be able to contribute to a 401(k) plan or a college savings fund.
They also might have a bearing on health system change efforts and post-retirement morbidity and mortality risk. Workers who have better work-life balance may be in a better position to get checkups, exercise and buy, cook and eat healthy foods. They might have higher-than-expected preventive care costs today, lower health claim costs in early retirement, and an above-average-need to plan for the possibility of living past age 100.
Of course, like any ranking of this kind, this one is based on an index formula that leaves out many variables that might be important to a particular client, such as proximity to oceans, rivers and mountains, or the average weekly grocery bill.
But these kinds of rankings could give benefits professionals ideas about how to use Census data to generate quality-of-life indicators that reflect their own thinking.
The nation: The best and worst figures for each indicator varied widely by state.
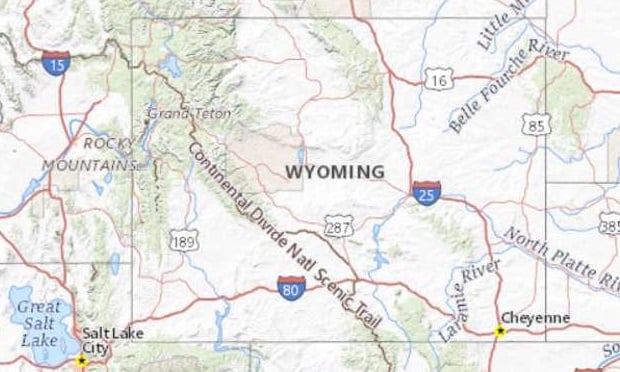
For the the commuting time indicator, for example, the percentage of workers with a commute under 20 minutes ranged from 69.6%, in Wyoming, down to 14.5%, in the District of Columbia.
The percentage of mid-career workers with employment-based health insurance ranged from 77.1%, in the District of Columbia, and 73.8%, in North Dakota, down to less than half, in New Mexico.
| Population | Quality of life index | Share of workers with a commute under 20 minutes | Share of renters and mortgage holders with housing costs over 30% of income | Share of people who are uninsured | Share of people ages 26 through 34 with employment-based health coverage | Percentage of people with income below the poverty line | Percentage of people with a disability | |
|---|---|---|---|---|---|---|---|---|
| Alabama | 4,833,722 | 21.0 | 41.0% | 20.8% | 13.6% | 62.6% | 18.7% | 15.9% |
| Alaska | 735,132 | 29.5 | 63.6% | 23.7% | 18.5% | 55.3% | 9.3% | 11.1% |
| Arizona | 6,626,624 | 17.3 | 39.9% | 26.6% | 17.1% | 60.7% | 18.6% | 12.3% |
| Arkansas | 2,959,373 | 18.3 | 50.8% | 20.9% | 16.0% | 55.9% | 19.7% | 17.1% |
| California | 38,332,521 | 15.5 | 36.4% | 36.4% | 17.2% | 59.0% | 16.8% | 10.6% |
| Colorado | 5,268,367 | 26.8 | 41.3% | 30.0% | 14.1% | 66.2% | 13.0% | 10.8% |
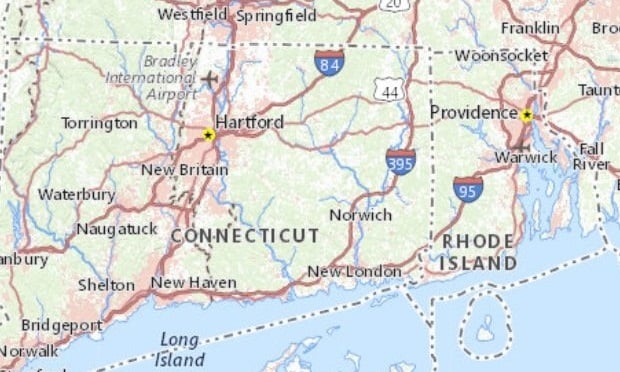
| Connecticut | 3,596,080 | 32.8 | 42.8% | 28.4% | 9.4% | 63.2% | 10.7% | 10.7% |
| Delaware | 925,749 | 29.8 | 41.0% | 23.8% | 9.1% | 63.3% | 12.4% | 12.6% |
| District of Columbia | 646,449 | 25.8 | 14.5% | 30.9 % | 6.7% | 77.1% | 18.9% | 10.8% |
| Florida | 19,552,860 | 8.7 | 34.2% | 30.8% | 20.0% | 54.3% | 17.0% | 13.4% |
| Georgia | 9,992,167 | 11.5 | 36.6% | 26.8% | 18.8% | 58.0% | 19.0% | 12.4% |
| Hawaii | 1,404,054 | 31.7 | 39.0% | 33.5% | 6.7% | 67.5% | 10.8% | 11.2% |
| Idaho | 1,612,136 | 24.0 | 54.5% | 24.1% | 16.2% | 59.9% | 15.6% | 13.1% |
| Illinois | 12,882,135 | 28.5 | 38.0% | 23.9% | 12.7% | 67.4% | 14.7% | 11.1% |
| Indiana | 6,570,902 | 26.7 | 46.6% | 21.7% | 14.0% | 64.5% | 15.9% | 13.9% |
| Iowa | 3,090,416 | 42.7 | 57.7% | 19.5% | 8.1% | 68.7% | 12.7% | 11.7% |
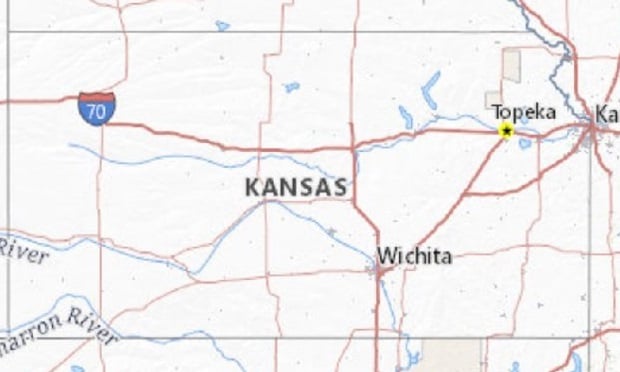
| Kansas | 2,893,957 | 35.3 | 55.8% | 21.4% | 12.3% | 66.8% | 14.0% | 12.4% |
| Kentucky | 4,395,295 | 20.2 | 46.6% | 21.0% | 14.3% | 60.2% | 18.8% | 17.0% |
| Louisiana | 4,625,470 | 11.7 | 44.8% | 24.9% | 16.6% | 50.8% | 19.8% | 15.0% |
| Maine | 1,328,302 | 25.5 | 47.3% | 22.1% | 11.2% | 59.2% | 14.0% | 16.3% |
| Maryland | 5,928,814 | 31.0 | 32.7% | 27.6% | 10.2% | 64.8% | 10.1% | 10.7% |
| Massachusetts | 6,692,824 | 30.2 | 34.4% | 30.1% | 3.7% | 68.1% | 11.9% | 11.8% |
| Michigan | 9,895,622 | 26.7 | 44.8% | 21.4% | 11.0% | 63.5% | 17.0% | 14.4% |
| Minnesota | 5,420,380 | 42.7 | 48.2% | 22.4% | 8.2% | 70.5% | 11.2% | 10.5% |
| Mississippi | 2,991,207 | 17.3 | 47.3% | 20.8% | 17.1% | 58.2% | 24.0% | 16.7% |
| Missouri | 6,044,171 | 29.2 | 46.6% | 21.0% | 13.0% | 66.6% | 15.9% | 14.4% |
| Montana | 1,015,165 | 20.7 | 62.7% | 23.1% | 16.5% | 54.1% | 16.5% | 14.0% |
| Nebraska | 1,868,516 | 39.7 | 59.4% | 21.3% | 11.3% | 69.6% | 13.2% | 11.2% |
| Nevada | 2,790,136 | 12.5 | 38.7% | 32.1% | 20.7% | 58.2% | 15.8% | 12.9% |
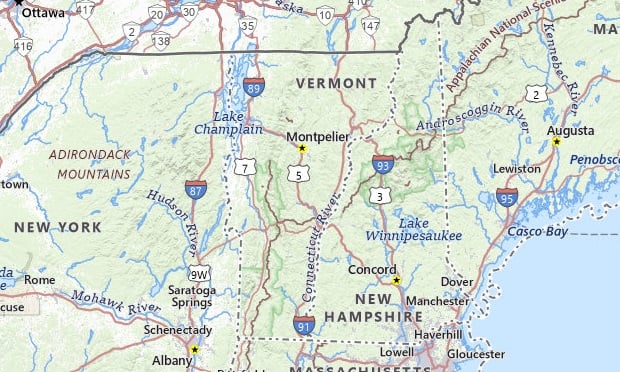
| New Hampshire | 1,323,459 | 34.7 | 44.0% | 24.6% | 10.7% | 70.7% | 8.7% | 12.7% |
| New Jersey | 8,899,339 | 27.7 | 36.8% | 29.1% | 13.2% | 63.5% | 11.4% | 10.6% |
| New Mexico | 2,085,287 | 14.8 | 51.7% | 22.9% | 18.6% | 49.5% | 21.9% | 15.2% |
| New York | 19,651,127 | 20.0 | 30.5% | 31.4% | 10.7% | 59.9% | 16.0% | 11.2% |
| North Carolina | 9,848,060 | 18.0 | 42.1% | 23.9% | 15.6% | 60.1% | 17.9% | 13.8% |
| North Dakota | 723,393 | 46.5 | 67.5% | 18.1% | 10.4% | 73.8% | 11.8% | 10.6% |
| Ohio | 11,570,808 | 28.2 | 45.2% | 21.9% | 11.0% | 63.3% | 16.0% | 13.6% |
| Oklahoma | 3,850,568 | 18.0 | 49.7% | 22.4% | 17.7% | 56.9% | 16.8% | 15.8% |
| Oregon | 3,930,065 | 19.5 | 48.8% | 29.6% | 14.7% | 61.8% | 16.7% | 14.7% |
| Pennsylvania | 12,773,801 | 30.5 | 41.3% | 22.3% | 9.7% | 65.7% | 13.7% | 13.4% |
| Rhode Island | 1,051,511 | 26.0 | 43.3% | 27.0% | 11.6% | 63.9% | 14.3% | 12.7% |
| South Carolina | 4,774,839 | 17.7 | 42.6% | 21.9% | 15.8% | 58.9% | 18.6% | 14.5% |
| South Dakota | 844,877 | 36.0 | 63.4% | 19.5% | 11.3% | 64.9% | 14.2% | 13.1% |
| Tennessee | 6,495,978 | 18.0 | 39.7% | 23.0% | 13.9% | 60.6% | 17.8% | 15.4% |
| Texas | 26,448,193 | 14.7 | 39.8% | 27.8% | 22.1% | 58.3% | 17.5% | 11.7% |
| Utah | 2,900,872 | 36.0 | 49.4% | 24.6% | 14.0% | 71.0% | 12.7% | 9.5% |
| Vermont | 626,630 | 31.7 | 48.0% | 23.0% | 7.2% | 60.3% | 12.3% | 13.8% |
| Virginia | 8,260,405 | 28.7 | 38.2% | 24.9% | 12.3% | 64.6% | 11.7% | 11.3% |
| Washington | 6,971,406 | 24.2 | 42.1% | 28.7% | 14.0% | 67.4% | 14.1% | 13.0% |
| West Virginia | 1,854,304 | 21.2 | 44.9% | 15.9% | 14.0% | 59.9% | 18.5% | 20.2% |
| Wisconsin | 5,742,713 | 39.2 | 50.9% | 21.5% | 9.1% | 70.1% | 13.5% | 12.1% |
| Wyoming | 582,658 | 35.8 | 69.6% | 20.4% | 13.4% | 58.7% | 10.9% | 11.9% |
| TOTAL | 316,128,839 | |||||||
| MEDIAN | 26.7% | 44.8% | 23.7% | 13.4% | 63.2% | 15.6% | 12.7% |
© Touchpoint Markets, All Rights Reserved. Request academic re-use from www.copyright.com. All other uses, submit a request to [email protected]. For more inforrmation visit Asset & Logo Licensing.
Allison Bell

Allison Bell, a senior reporter at ThinkAdvisor and BenefitsPRO, previously was an associate editor at National Underwriter Life & Health. She has a bachelor's degree in economics from Washington University in St. Louis and a master's degree in journalism from the Medill School of Journalism at Northwestern University. She can be reached through X at @Think_Allison.


