
Workers may be less achy than they used to be.
About 20% of the working-age Americans in a typical state reported in 2023 that they had some form of arthritis.
The median was down from 21.5% in 2018, before the COVID-19 pandemic appeared, according to new data from the U.S. Centers for Disease Control and Prevention's Behavioral Risk Factor Surveillance System survey program.
Recommended For You
The reported arthritis rate ranged from less than 15%, in three states, up to more than 25%, in four states.
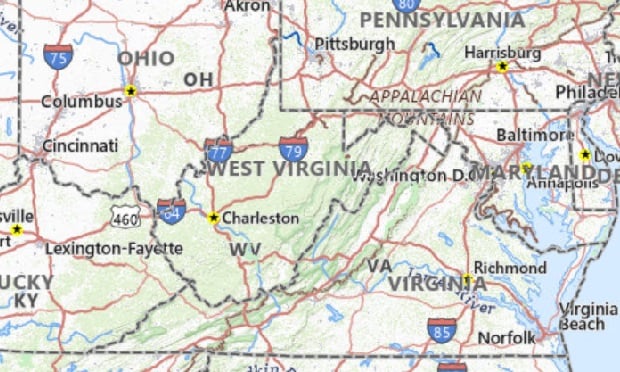
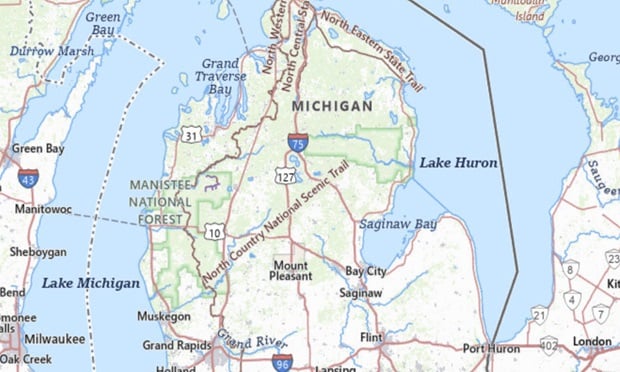
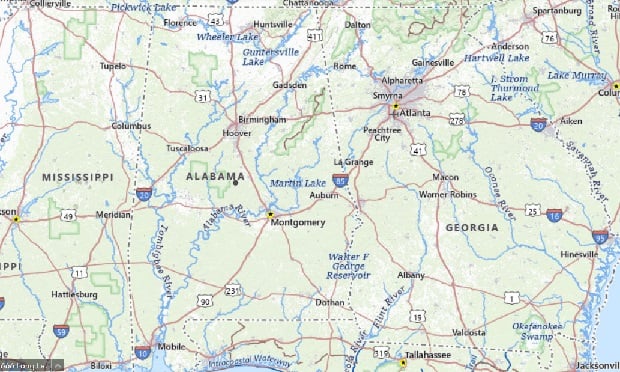
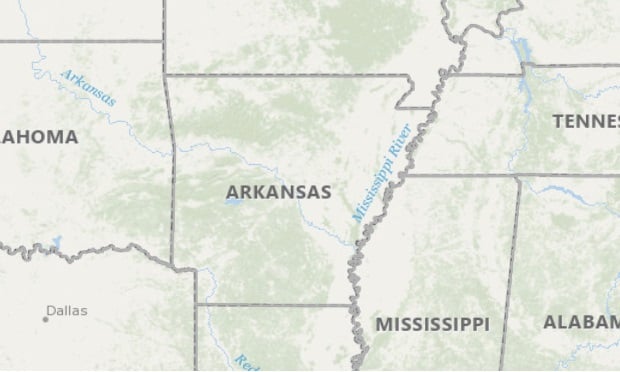
For a look at the five states with the highest arthritis prevalence for working-age adults, see the gallery above.
For data for all 50 states, the District of Columbia and Puerto Rico, see the table below.
Methods: The CDC breaks down data on arthritis prevalence for people under 18, people ages 65 and older, and four age groups from 18 through 64.
We came up with an arthritis prevalence rate for working-age people by averaging the data for the age groups in that age range. One benefit of using that approach is that it filters out the effects of the aging of the population, or other population trends, in a given state.
At press time, the CDC had not included data from Kentucky and Pennsylvania in the 2023 BRFSS results.
The impact: At employer plans, about 0.4% of the members have rheumatoid arthritis, and total medical costs for the members with arthritis averaged about $17,000, according to a 2020 study by researchers at Cambia Health Solutions and Prime Therapeutics.
Pharmacy benefit managers affiliated with the three biggest health insurers have started moving away from covering Humira, a popular and very expensive immune system control drug that is used to treat rheumatoid arthritis and other inflammatory conditions, but, in 2023, Humira cost employers more than any other drug, according to Milliman.
About 5% of workers surveyed in 2009 reported having osteoarthritis in the past month, and they were much less likely than other workers to be working full-time or earning more than $75,000 per year, according to an analysis of U.S. Centers for Disease Control and Prevention survey data by employees at Pfizer and Kantar Health.
The cost of medical care for the workers with osteoarthritis averaged $3,702 per year, compared with $2,158 for the other workers.
Productivity lost due to health problems averaged $15,047 for workers with arthritis pain and $8,175 for the other workers.
Arthritis prevalence tends to correlate with states' overall health benefits environment, because some forms may reflect the effects of certain kinds of work on joint and bone health, and disability programs in some states may how seriously patients and providers take joint pain.
| Adults Ages 18-64 Who Have Arthritis | |||
| 2018 | 2023 | Change, in percentage points | |
| Alabama | 26.10% | 25.40% | -0.70 |
| Alaska | 27.57% | 21.30% | -6.27 |
| Arizona | 18.44% | 20.03% | 1.59 |
| Arkansas | 29.58% | 27.33% | -2.25 |
| California | 14.12% | 13.82% | -0.30 |
| Colorado | 16.00% | 15.06% | -0.94 |
| Connecticut | 21.05% | 17.40% | -3.65 |
| Delaware | 21.65% | 22.45% | 0.80 |
| District of Columbia | 18.33% | 15.28% | -3.05 |
| Florida | 17.12% | 14.58% | -2.54 |
| Georgia | 19.04% | 20.33% | 1.29 |
| Hawaii | 16.22% | 19.38% | 3.16 |
| Idaho | 21.70% | 18.66% | -3.04 |
| Illinois | 20.58% | 18.90% | -1.68 |
| Indiana | 21.08% | 20.66% | -0.42 |
| Iowa | 17.52% | 18.48% | 0.96 |
| Kansas | 18.56% | 18.32% | -0.24 |
| Kentucky | 25.30% | NA | - |
| Louisiana | 26.83% | 22.50% | -4.33 |
| Maine | 26.78% | 21.42% | -5.36 |
| Maryland | 18.72% | 15.84% | -2.88 |
| Massachusetts | 16.42% | 17.44% | 1.02 |
| Michigan | 23.50% | 24.50% | 1.00 |
| Minnesota | 14.62% | 14.22% | -0.40 |
| Mississippi | 25.14% | 22.52% | -2.62 |
| Missouri | 27.65% | 19.98% | -7.67 |
| Montana | 19.78% | 19.26% | -0.52 |
| Nebraska | 18.30% | 16.06% | -2.24 |
| Nevada | 21.48% | 23.97% | 2.49 |
| New Hampshire | 24.40% | 22.30% | -2.10 |
| New Jersey | 21.27% | 15.73% | -5.54 |
| New Mexico | 23.23% | 27.70% | 4.48 |
| New York | 14.84% | 15.04% | 0.20 |
| North Carolina | 23.03% | 22.10% | -0.92 |
| North Dakota | 23.98% | 18.74% | -5.24 |
| Ohio | 22.36% | 20.84% | -1.52 |
| Oklahoma | 21.44% | 21.30% | -0.14 |
| Oregon | 21.06% | 22.15% | 1.09 |
| Pennsylvania | 24.15% | NA | - |
| Puerto Rico | 25.47% | 19.83% | -5.64 |
| Rhode Island | 24.45% | 21.23% | -3.23 |
| South Carolina | 26.43% | 23.28% | -3.15 |
| South Dakota | 19.88% | 24.20% | 4.33 |
| Tennessee | 29.55% | 24.08% | -5.47 |
| Texas | 15.88% | 18.38% | 2.50 |
| Utah | 17.12% | 17.44% | 0.32 |
| Vermont | 23.00% | 20.73% | -2.28 |
| Virginia | 22.53% | 22.95% | 0.43 |
| Washington | 17.00% | 16.18% | -0.82 |
| West Virginia | 35.28% | 33.38% | -1.90 |
| Wisconsin | 22.30% | 17.58% | -4.72 |
| Wyoming | 21.60% | 18.82% | -2.78 |
| MEDIAN | 21.54% | 20.00% | -1.54 |
© Touchpoint Markets, All Rights Reserved. Request academic re-use from www.copyright.com. All other uses, submit a request to [email protected]. For more inforrmation visit Asset & Logo Licensing.
Allison Bell

Allison Bell, a senior reporter at ThinkAdvisor and BenefitsPRO, previously was an associate editor at National Underwriter Life & Health. She has a bachelor's degree in economics from Washington University in St. Louis and a master's degree in journalism from the Medill School of Journalism at Northwestern University. She can be reached through X at @Think_Allison.


