


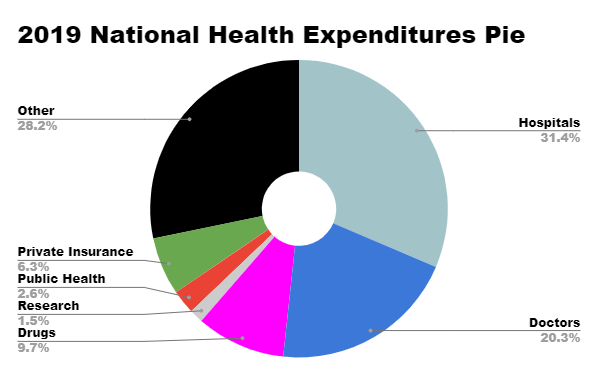


Increases in spending on hospital care, physician services and prescription drugs squeezed U.S. commercial health insurers in 2019, according to new federal government health spending data. Health insurers' revenue increased 3.7% between 2018 and 2019, to $1.2 trillion. Although revenue rose, the "net cost of health insurance" fell to $131 billion, from $142 billion in 2018. The net cost of health insurance is the amount private health insurers have left overpaying after paying claims. The Office of the Actuary at the Centers for Medicare and Medicaid Services (CMS) published the health insurance spending figures earlier this week in a new batch of national health expenditures tables. The report reflects the effects of a measles outbreak that hit the United States in 2019. The report does include the impact of COVID-19 pandemic. Links to the National Health Expenditures Accounts tables and related documents are available here. Overall national health spending increased 4.6% in 2019, to $3.8 trillion, or 17.7% of gross domestic product. In 2018, U.S. health spending increased 4.7%. Here's a look at how key items in the health spending tables changed between 2018 and 2019:
- Home Health Care: $113 billion (Up 7.7%)
- Structures and Equipment: $145 billion (Up 6.3%)
- Hospitals: $1.2 trillion (Up 6.2%)
- Prescription Drugs: $370 billion (Up 5.7%)
- Medical Research: $57 billion (Up 5.5%)
- Durable Medical Equipment: $58 billion (Up 5%)
- Doctors: $772 billion (Up 4.6%)
- Nursing Home Care: $173 billion (Up 3.3%)
- Net Cost of Private Health Insurance: $240 billion (Down 3.8%)
- The U.S. Population: 328 million (Up 0.5%%)
- U.S. Gross Domestic Product: $21.4 trillion (Up 4%)
NOT FOR REPRINT
© 2025 ALM Global, LLC, All Rights Reserved. Request academic re-use from www.copyright.com. All other uses, submit a request to [email protected]. For more information visit Asset & Logo Licensing.
Allison Bell

Allison Bell, a senior reporter at ThinkAdvisor and BenefitsPRO, previously was an associate editor at National Underwriter Life & Health. She has a bachelor's degree in economics from Washington University in St. Louis and a master's degree in journalism from the Medill School of Journalism at Northwestern University. She can be reached through X at @Think_Allison.


