

.
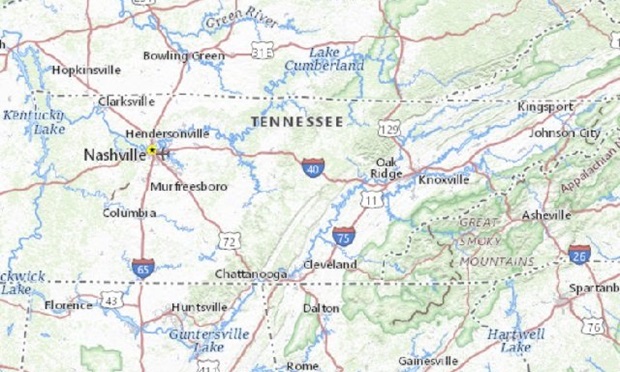
The state averages ranged from $3.98, in Wyoming, up to a high of $23.09, in one state in the Southeast. (The District of Columbia would have been the leader if we'd included it in the rankings.).
About $2.2 billion of the broker compensation was paid in the form of commissions and $652 million in the form of fees..
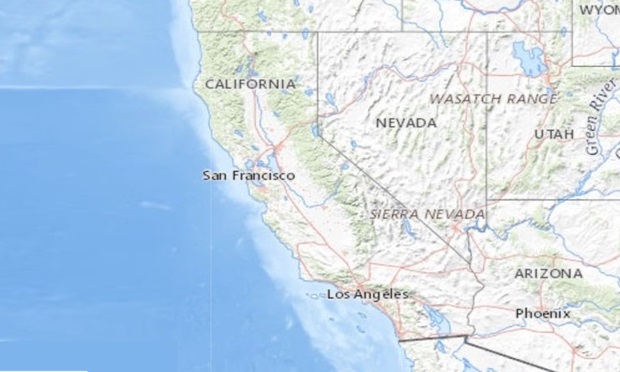
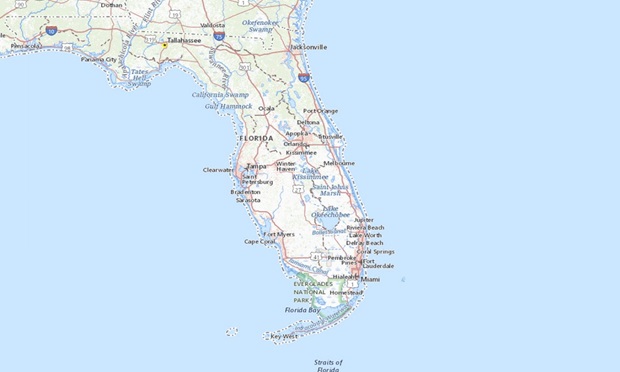
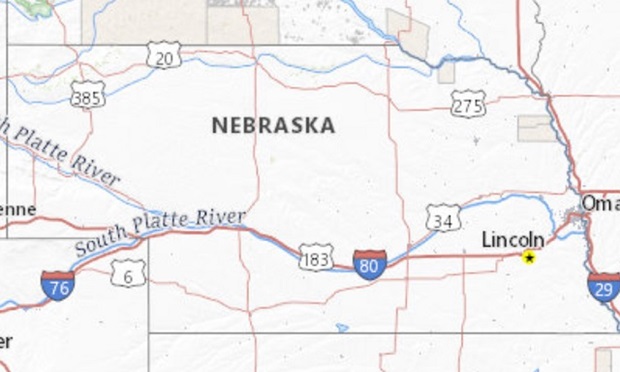
For a look at the 10 states with the highest average amount of Form 5500 health and welfare broker compensation per worker, see the gallery above..
For data for all 50 states and, for this purpose, the District of Columbia, see the table below.The data
Employers are supposed to file the regular Form 5500 for plans with more than 100 participants or when the employer funds a plan of any size with trust.
.
The Labor Department posts the aggregate data in large, unwieldy spreadsheets. Firms like Judy Diamond Associates provide the plan information in a much more manageable form.
.
We came up with the state averages by using the acknowledgment identification numbers in the Form 5500 record files, which show where the plan sponsors are located, with the Form 5500 Schedule A records, which show broker commission and fee payments.
.
The analysis excludes broker compensation information for plans that are not subject to the Form 5500 filing requirements or that have not yet submitted their forms.
.
Related: CMS: U.S. employers to spend $1.3T on health benefits this year.
We also tried to exclude records for plan years ending in years other than 2023 and any broker compensation records that failed to match with a Form 5500.
.
In some cases, state-to-state variations in average commissions may reflect differences in how many workers in a state have jobs with benefits. In other cases, the differences may reflect the role of headquarters offices, regional offices, professional employer organizations, multiple employer plans or other types of employment and benefits arrangements on which entity filed the Form 5500 for the workers in a given location.
| .. | Form 5500 broker comp | Workers over 16 | Broker comp per worker |
| ..Alabama.. | ..$32,259,667.. | ..2,347,036.. | ..$13.74.. |
| ..Alaska.. | ..$3,254,840.. | ..382,857.. | ..$8.50.. |
| ..Arizona.. | ..$41,956,446.. | ..3,487,472.. | ..$12.03.. |
| ..Arkansas.. | ..$14,066,806.. | ..1,398,233.. | ..$10.06.. |
| ..California.. | ..$358,808,218.. | ..20,161,988.. | ..$17.80.. |
| ..Colorado.. | ..$41,322,138.. | ..3,207,091.. | ..$12.88.. |
| ..Connecticut.. | ..$33,513,152.. | ..1,954,584.. | ..$17.15.. |
| ..Delaware.. | ..$3,083,684.. | ..505,419.. | ..$6.10.. |
| ..District.of.Columbia.. | ..$16,831,585.. | ..400,882.. | ..$41.99.. |
| ..Florida.. | ..$189,798,877.. | ..10,628,791.. | ..$17.86.. |
| ..Georgia.. | ..$79,654,589.. | ..5,408,659.. | ..$14.73.. |
| ..Hawaii.. | ..$3,761,856.. | ..760,259.. | ..$4.95.. |
| ..Idaho.. | ..$7,472,610.. | ..912,969.. | ..$8.18.. |
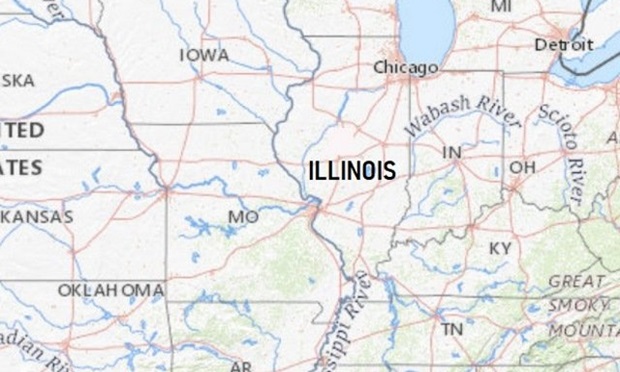
| ..Illinois.. | ..$142,095,979.. | ..6,698,657.. | ..$21.21.. |
| ..Indiana.. | ..$41,149,715.. | ..3,444,785.. | ..$11.95.. |
| ..Iowa.. | ..$18,364,246.. | ..1,694,783.. | ..$10.84.. |
| ..Kansas.. | ..$12,868,809.. | ..1,532,831.. | ..$8.40.. |
| ..Kentucky.. | ..$27,516,170.. | ..2,146,427.. | ..$12.82.. |
| ..Louisiana.. | ..$30,948,868.. | ..2,178,498.. | ..$14.21.. |
| ..Maine.. | ..$8,044,495.. | ..714,007.. | ..$11.27.. |
| ..Maryland.. | ..$32,577,509.. | ..3,331,304.. | ..$9.78.. |
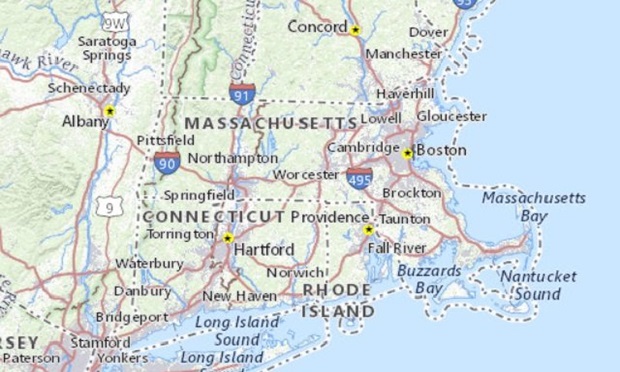
| ..Massachusetts.. | ..$84,431,946.. | ..3,881,592.. | ..$21.75.. |
| ..Michigan.. | ..$84,037,019.. | ..5,022,353.. | ..$16.73.. |
| ..Minnesota.. | ..$55,372,349.. | ..3,117,089.. | ..$17.76.. |
| ..Mississippi.. | ..$10,786,129.. | ..1,343,921.. | ..$8.03.. |
| ..Missouri.. | ..$42,285,043.. | ..3,107,508.. | ..$13.61.. |
| ..Montana.. | ..$7,782,784.. | ..559,192.. | ..$13.92.. |
| ..Nebraska.. | ..$19,442,428.. | ..1,054,257.. | ..$18.44.. |
| ..Nevada.. | ..$14,811,620.. | ..1,578,965.. | ..$9.38.. |
| ..New Hampshire.. | ..$9,251,480.. | ..769,933.. | ..$12.02.. |
| ..New Jersey.. | ..$59,614,896.. | ..4,939,850.. | ..$12.07.. |
| ..New Mexico.. | ..$4,297,177.. | ..977,087.. | ..$4.40.. |
| ..New York.. | ..$156,820,480.. | ..10,278,402.. | ..$15.26.. |
| ..North Carolina.. | ..$58,167,198.. | ..5,292,296.. | ..$10.99.. |
| ..North Dakota.. | ..$9,424,975.. | ..423,527.. | ..$22.25.. |
| ..Ohio.. | ..$95,101,369.. | ..5,995,737.. | ..$15.86.. |
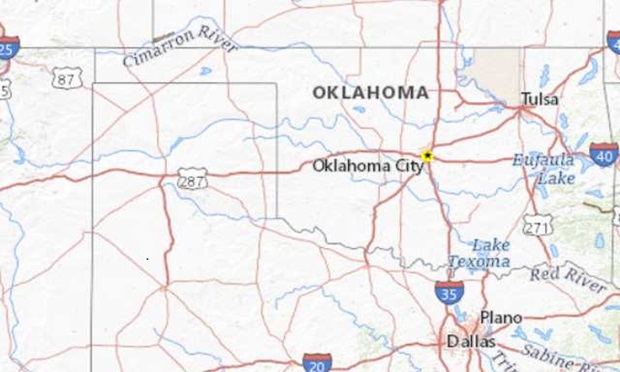
| ..Oklahoma.. | ..$36,694,969.. | ..1,914,154.. | ..$19.17.. |
| ..Oregon.. | ..$24,482,790.. | ..2,170,345.. | ..$11.28.. |
| ..Pennsylvania.. | ..$88,191,915.. | ..6,691,863.. | ..$13.18.. |
| ..Puerto Rico.. | ..$18,462,556.. | ..1,250,873.. | ..$14.76.. |
| ..Rhode Island.. | ..$5,750,648.. | ..592,223.. | ..$9.71.. |
| ..South Carolina.. | ..$33,301,188.. | ..2,516,635.. | ..$13.23.. |
| ..South Dakota.. | ..$3,956,476.. | ..471,598.. | ..$8.39.. |
| ..Tennessee.. | ..$79,689,309.. | ..3,451,793.. | ..$23.09.. |
| ..Texas.. | ..$244,180,048.. | ..14,776,656.. | ..$16.52.. |
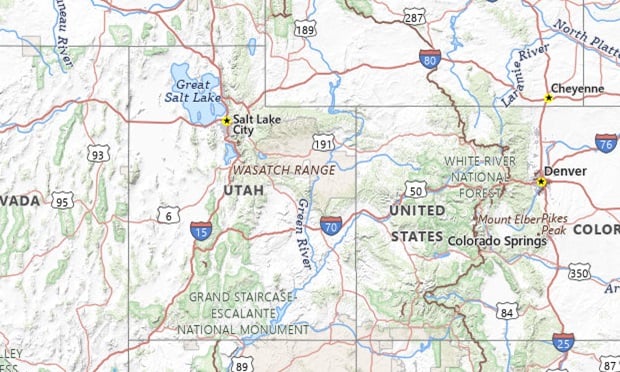
| ..Utah.. | ..$33,804,342.. | ..1,703,624.. | ..$19.84.. |
| ..Vermont..x | ..$4,450,407.. | ..351,725.. | ..$12.65.. |
| ..Virginia.. | ..$61,661,531.. | ..4,574,094.. | ..$13.48.. |
| ..Washington.. | ..$36,418,725.. | ..4,011,152.. | ..$9.08.. |
| ..West Virginia.. | ..$3,768,222.. | ..785,678.. | ..$4.80.. |
| ..Wisconsin.. | ..$49,556,448.. | ..3,130,460.. | ..$15.83.. |
| ..Wyoming.. | ..$1,204,584.. | ..302,639.. | ..$3.98.. |
| ..TOTAL.. | ..$2,575,346,726.. | ..170,334,750.. | ..$15.12.. |
| ..MEDIAN.. | ..$13.03.. |
© Touchpoint Markets, All Rights Reserved. Request academic re-use from www.copyright.com. All other uses, submit a request to [email protected]. For more inforrmation visit Asset & Logo Licensing.
Allison Bell

Allison Bell, a senior reporter at ThinkAdvisor and BenefitsPRO, previously was an associate editor at National Underwriter Life & Health. She has a bachelor's degree in economics from Washington University in St. Louis and a master's degree in journalism from the Medill School of Journalism at Northwestern University. She can be reached through X at @Think_Allison.


