More workers have a threat lurking in their blood vessels.
Cholesterol is a waxy substance involved in building healthy cells. When it gets out of control, it can contribute to hardening of the arteries, heart disease and stroke, and higher employer plan claims.
About 28.3% of the working-age Americans in a typical state reported in 2023 had high cholesterol.
Recommended For You
The median was up from 25.8% in 2019, before the COVID-19 pandemic appeared, according to new data from the U.S. Centers for Disease Control and Prevention's Behavioral Risk Factor Surveillance System survey program.
Prevalence ranged from less than 24%, in Montana, up to almost 37%, in one state on the East Coast.
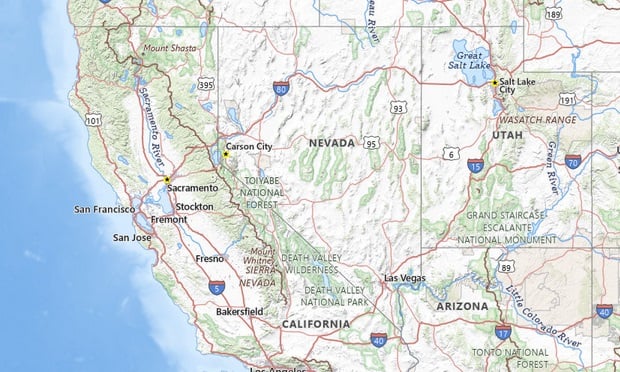
For a look at the five states with the highest high-cholesterol rates for working-age adults, see the gallery above.
For data for all 50 states, the District of Columbia and Puerto Rico, see the table below.
Methods: The CDC breaks down data on cholesterol levels for people under 18, people ages 65 and older, and four age groups from 18 through 64.
We came up with a prevalence rate for high cholesterol levels for working-age people by averaging the data for the age groups in that age range.
One benefit of using that approach is that it filters out the effects of the aging of the population, or other population trends, in a given state.
At press time, the CDC had not included data from Kentucky and Pennsylvania in the 2023 BRFSS results.
The impact: Physicians classify patients as having high cholesterol, or "hyperlipidemia," if they have more than 200 milligrams of cholesterol per deciliter of blood.
About 10% of American adults have high blood cholesterol levels, according to the CDC's National Health and Nutrition Examination Survey data gathered from 2017 through 2020, and private health insurers have been spending about $7.8 billion on statins per year, according to a JAMA Network article.
Researchers have not produced much research on the direct economic impact of high cholesterol levels, but employers see high cholesterol levels as a sign of trouble.
About 40% of employers identified cardiovascular conditions as one of the top three drivers of health benefits cost increases in 2024, according to a Business Group on Health 2025 employer survey.
| Adults Ages 18-64 Who Have High Cholesterol | |||
| 2019 | 2023 | Change, in percentage points | |
| Alabama | 32.45 | 31.66 | -0.79 |
| Alaska | 26.10 | 25.08 | -1.02 |
| Arizona | 26.04 | 30.42 | +4.38 |
| Arkansas | 32.20 | 30.38 | -1.82 |
| California | 23.54 | 29.52 | +5.98 |
| Colorado | 26.30 | 24.30 | -2.00 |
| Connecticut | 26.74 | 30.08 | +3.34 |
| Delaware | 28.25 | 36.95 | +8.70 |
| District of Columbia | 27.35 | 30.24 | +2.89 |
| Florida | 24.06 | 28.28 | +4.22 |
| Georgia | 25.02 | 28.24 | +3.22 |
| Hawaii | 22.72 | 27.90 | +5.18 |
| Idaho | 27.48 | 26.10 | -1.38 |
| Illinois | 23.24 | 27.92 | +4.68 |
| Indiana | 24.12 | 28.66 | +4.54 |
| Iowa | 23.18 | 26.46 | +3.28 |
| Kansas | 25.66 | 27.80 | +2.14 |
| Kentucky | 28.38 | NA | - |
| Louisiana | 29.40 | 31.26 | +1.86 |
| Maine | 28.15 | 26.12 | -2.03 |
| Maryland | 27.16 | 31.10 | +3.94 |
| Massachusetts | 22.44 | 27.00 | +4.56 |
| Michigan | 24.56 | 25.78 | +1.22 |
| Minnesota | 20.74 | 24.18 | +3.44 |
| Mississippi | 32.15 | 29.24 | -2.91 |
| Missouri | 26.48 | 27.58 | +1.10 |
| Montana | 24.03 | 23.14 | -0.88 |
| Nebraska | 21.76 | 24.88 | +3.12 |
| Nevada | 27.88 | 35.78 | +7.90 |
| New Hampshire | 26.55 | 29.03 | +2.48 |
| New Jersey | NA | 31.50 | - |
| New Mexico | 22.64 | 30.35 | +7.71 |
| New York | 24.72 | 30.00 | +5.28 |
| North Carolina | 25.84 | 31.65 | +5.81 |
| North Dakota | 23.83 | 25.90 | +2.08 |
| Ohio | 23.66 | 27.72 | +4.06 |
| Oklahoma | 31.75 | 28.74 | -3.01 |
| Oregon | 21.08 | 25.06 | +3.98 |
| Pennsylvania | 24.40 | NA | - |
| Puerto Rico | 30.36 | 33.84 | +3.48 |
| Rhode Island | 24.54 | 26.02 | +1.48 |
| South Carolina | 26.66 | 28.22 | +1.56 |
| South Dakota | 31.03 | 30.40 | -0.63 |
| Tennessee | 26.74 | 31.66 | +4.92 |
| Texas | 27.40 | 29.42 | +2.02 |
| Utah | 23.60 | 24.92 | +1.32 |
| Vermont | 23.60 | 26.53 | +2.93 |
| Virginia | 24.78 | 30.06 | +5.28 |
| Washington | 23.14 | 26.74 | +3.60 |
| West Virginia | 34.53 | 32.76 | -1.76 |
| Wisconsin | 28.13 | 25.82 | -2.31 |
| Wyoming | 22.78 | 27.33 | +4.55 |
| MEDIAN | 25.84% | 28.26% | |
© Touchpoint Markets, All Rights Reserved. Request academic re-use from www.copyright.com. All other uses, submit a request to [email protected]. For more inforrmation visit Asset & Logo Licensing.


