


About 3.39% of the working-age Americans in a typical state were coping with the devastation of chronic kidney disease in 2023.
The median was up from 3.17% in 2022, and it was up from 3.05% five years earlier, in 2018, before the COVID-19 pandemic appeared, according to new data from the U.S. Centers for Disease Control and Prevention's Behavioral Risk Factor Surveillance System survey program.
Recommended For You
The rate ranged from just a little over 2%, in New York state, up to more than 5%, in the three states.
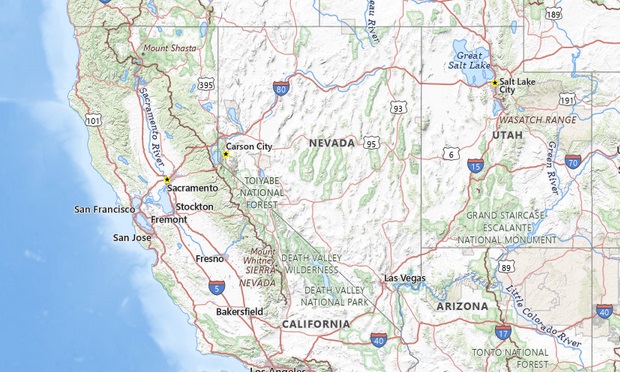
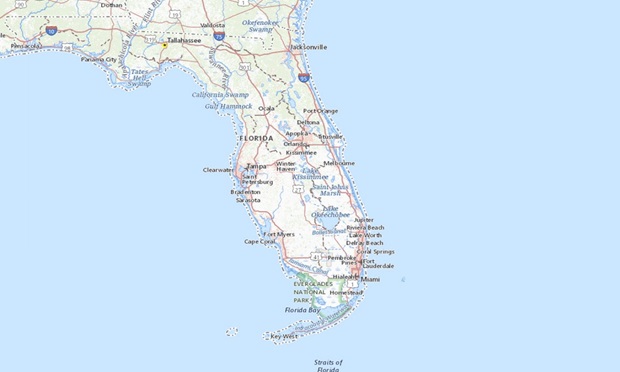
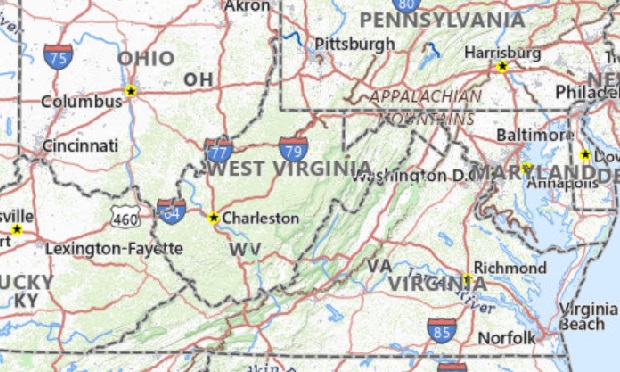
For a look at the five states with the highest chronic kidney disease rates for people ages 18 through 64, see the gallery above.
For data on all 50 states and two other state-like jurisdictions, Puerto Rico and the District of Columbia, see the table below.
Methods: The CDC breaks down data on kidney disease for people under 18, people ages 65 and older, and four age groups from 18 through 64.
We came up with a kidney disease prevalence rate for working-age people by averaging the data for the age groups in that age range.
One benefit of using that approach is that it filters out the effects of the aging of the population, or other population trends, in a given state.
Kentucky and Pennsylvania did not participate in the survey in 2023.
Alaska posted too little kidney disease data for some age groups in 2018 for its 2018 rate to be comparable to other states' rates.
The impact: Kidney disease can lead to use of dialysis services, poor quality of life, early death and organ transplants.Workers who need dialysis or kidney transplants may qualify for Medicare coverage after about three years, but an employer can expect to pay about $300,000 in claims per year for an employee or former employee on dialysis who is waiting to Medicare to open up, according to Healthgram, a self-funded plan designer.
| Adults Ages 18-64 Who Have Chronic Kidney Disease | |||
| Kidney | 2018 | 2023 | Change, in percentage points |
| Alabama | 4.85% | 4.85% | 0 |
| Alaska | NA | 2.60% | - |
| Arizona | 4.65% | 4.15% | -0.50 |
| Arkansas | 3.45% | 4.30% | +0.85 |
| California | 2.33% | 2.68% | +0.35 |
| Colorado | 2.30% | 2.77% | +0.47 |
| Connecticut | 2.60% | 2.20% | -0.40 |
| Delaware | 3.80% | 4.50% | +0.70 |
| District of Columbia | 3.45% | 3.40% | -0.05 |
| Florida | 3.40% | 4.80% | +1.40 |
| Georgia | 2.87% | 2.87% | 0 |
| Hawaii | 2.77% | 3.50% | +0.73 |
| Idaho | 3.80% | 3.95% | +0.15 |
| Illinois | 3.30% | 3.20% | -0.10 |
| Indiana | 3.75% | 3.90% | +0.15 |
| Iowa | 2.45% | 3.00% | +0.55 |
| Kansas | 2.87% | 2.80% | -0.07 |
| Kentucky | 4.20% | NA | - |
| Louisiana | 5.30% | 4.65% | -0.65 |
| Maine | 2.70% | 3.10% | +0.40 |
| Maryland | 2.77% | 2.67% | -0.10 |
| Massachusetts | 2.95% | 2.43% | -0.52 |
| Michigan | 3.20% | 3.47% | +0.27 |
| Minnesota | 1.68% | 2.67% | +0.99 |
| Mississippi | 3.00% | 4.15% | +1.15 |
| Missouri | 2.55% | 3.35% | +0.80 |
| Montana | 2.60% | 2.95% | +0.35 |
| Nebraska | 2.77% | 2.57% | -0.20 |
| Nevada | 6.30% | 5.90% | -0.40 |
| New Hampshire | 3.00% | 2.50% | -0.50 |
| New Jersey | 5.10% | 2.93% | -2.17 |
| New Mexico | 3.85% | 4.00% | +0.15 |
| New York | 2.15% | 2.03% | -0.13 |
| North Carolina | 3.30% | 4.10% | +0.80 |
| North Dakota | 2.25% | 3.65% | +1.40 |
| Ohio | 2.70% | 3.60% | +0.90 |
| Oklahoma | 4.20% | 3.53% | -0.67 |
| Oregon | 3.05% | 3.45% | +0.40 |
| Pennsylvania | 3.50% | NA | - |
| Puerto Rico | 4.45% | 4.70% | +0.25 |
| Rhode Island | 2.35% | 3.50% | +1.15 |
| South Carolina | 3.55% | 3.38% | -0.18 |
| South Dakota | 3.30% | 3.70% | +0.40 |
| Tennessee | 4.95% | 5.50% | +0.55 |
| Texas | 3.90% | 3.07% | -0.83 |
| Utah | 2.45% | 2.80% | +0.35 |
| Vermont | 2.40% | 2.90% | +0.50 |
| Virginia | 2.67% | 3.70% | +1.03 |
| Washington | 2.57% | 2.40% | -0.17 |
| West Virginia | 5.90% | 5.60% | -0.30 |
| Wisconsin | 4.40% | 2.70% | -1.70 |
| Wyoming | 2.90% | 3.20% | +0.30 |
| MEDIAN | 3.05% | 3.39% | +0.34 |
© 2025 ALM Global, LLC, All Rights Reserved. Request academic re-use from www.copyright.com. All other uses, submit a request to [email protected]. For more information visit Asset & Logo Licensing.
Allison Bell

Allison Bell, a senior reporter at ThinkAdvisor and BenefitsPRO, previously was an associate editor at National Underwriter Life & Health. She has a bachelor's degree in economics from Washington University in St. Louis and a master's degree in journalism from the Medill School of Journalism at Northwestern University. She can be reached through X at @Think_Allison.


