 Jobs are increasing in these states, (Photo: Shutterstock)
Most states gained jobs in 2016, with 26 and the District of Columbia reporting statistically significant gains.
According to a report from Governing, Department of Labor figures say all but nine states reported gains in employment year over year, with states that did especially well during 2016 having performed similarly in 2015.
While it didn't make the top 10, California — at 11th place — actually accounted for the largest number of jobs, if not the largest percentage of growth, with the addition of 333,000 jobs, growing at a rate of 2 percent. In December of 2015, the total number of jobs in the state was 16,274,100, while in December of 2016 that had grown to 16,606,600.
Comparing annual averages for each state “yields mostly similar results.” When calculated this way, Arizona and Idaho recorded stronger growth last year, while states like Missouri didn't add as many jobs as their December estimates suggest.
Most state economies continued to grow in 2016, but two-thirds of them did so more slowly than they did in 2015. Comparing annual average growth rates with 2014–2015 figures indicates that North Dakota, Oklahoma and Wyoming experienced the largest percentage-point rate reductions, while growth accelerated in Michigan, South Dakota and a few other states.
Related: 5 job trends to watch in 2017
And it wasn't all good news, of course; oil-producing states were on the losing end of the jobs issue, with Wyoming and North Dakota recording the biggest losses at -2.8 percent and -1.8 percent, respectively. Alaska, which was relatively flat in 2015, lost jobs in 2016 — and that situation could worsen if there are federal and state cutbacks, since public employees make up nearly 25 percent of the state's workforce.
|10. Massachusetts
The Bay State saw job growth of 2.1 percent, with its private sector doing even better at 2.4 percent. The total number of jobs in December of 2015 was 3,515,400, while by December of 2016 that had grown to 3,590,400 — for an addition of 75,000 jobs.
The state's annual average for 2014–2015 was 1.7 percent.
|9. Hawaii
Hawaii's overall job growth of 2.1 percent was pretty respectable, but its private sector saw higher improvement, coming in at 2.5 percent. The Aloha State's total job market went from 642,000 to 655, 200 — a gain of 13,200 jobs.
From 2014–2015, Hawaii's annual average was 1.5 percent.
|8. Missouri
The Show Me State added 64,500 jobs from December of 2015 to December of 2016, recording an increase of 2.3 percent. In the private sector, the increase was higher, at 2.6 percent.
Missouri's 2014–2015 annual average was 1.7 percent.
|7. Washington, D.C.
The District of Columbia saw a higher percentage of jobs added to its total overall than it did in its private sector, recording a gain of 2.2 percent in private sector positions and 2.3 percent generally. That accounts for 17,500 jobs as DC climbed from 2015's 768,100 to 2016's 785,600.
The District's annual average for 2014–2015 was 1.7 percent.
|6. Georgia
Georgia made gains of 103,300 jobs from December of 2015 to December of 2016, going from 4,330,100 to 4,433,400. That was a gain of 2.4 percent overall, and 2.5 percent in its private sector.
Georgia's annual average for 2014–2015 was 2.9 percent.
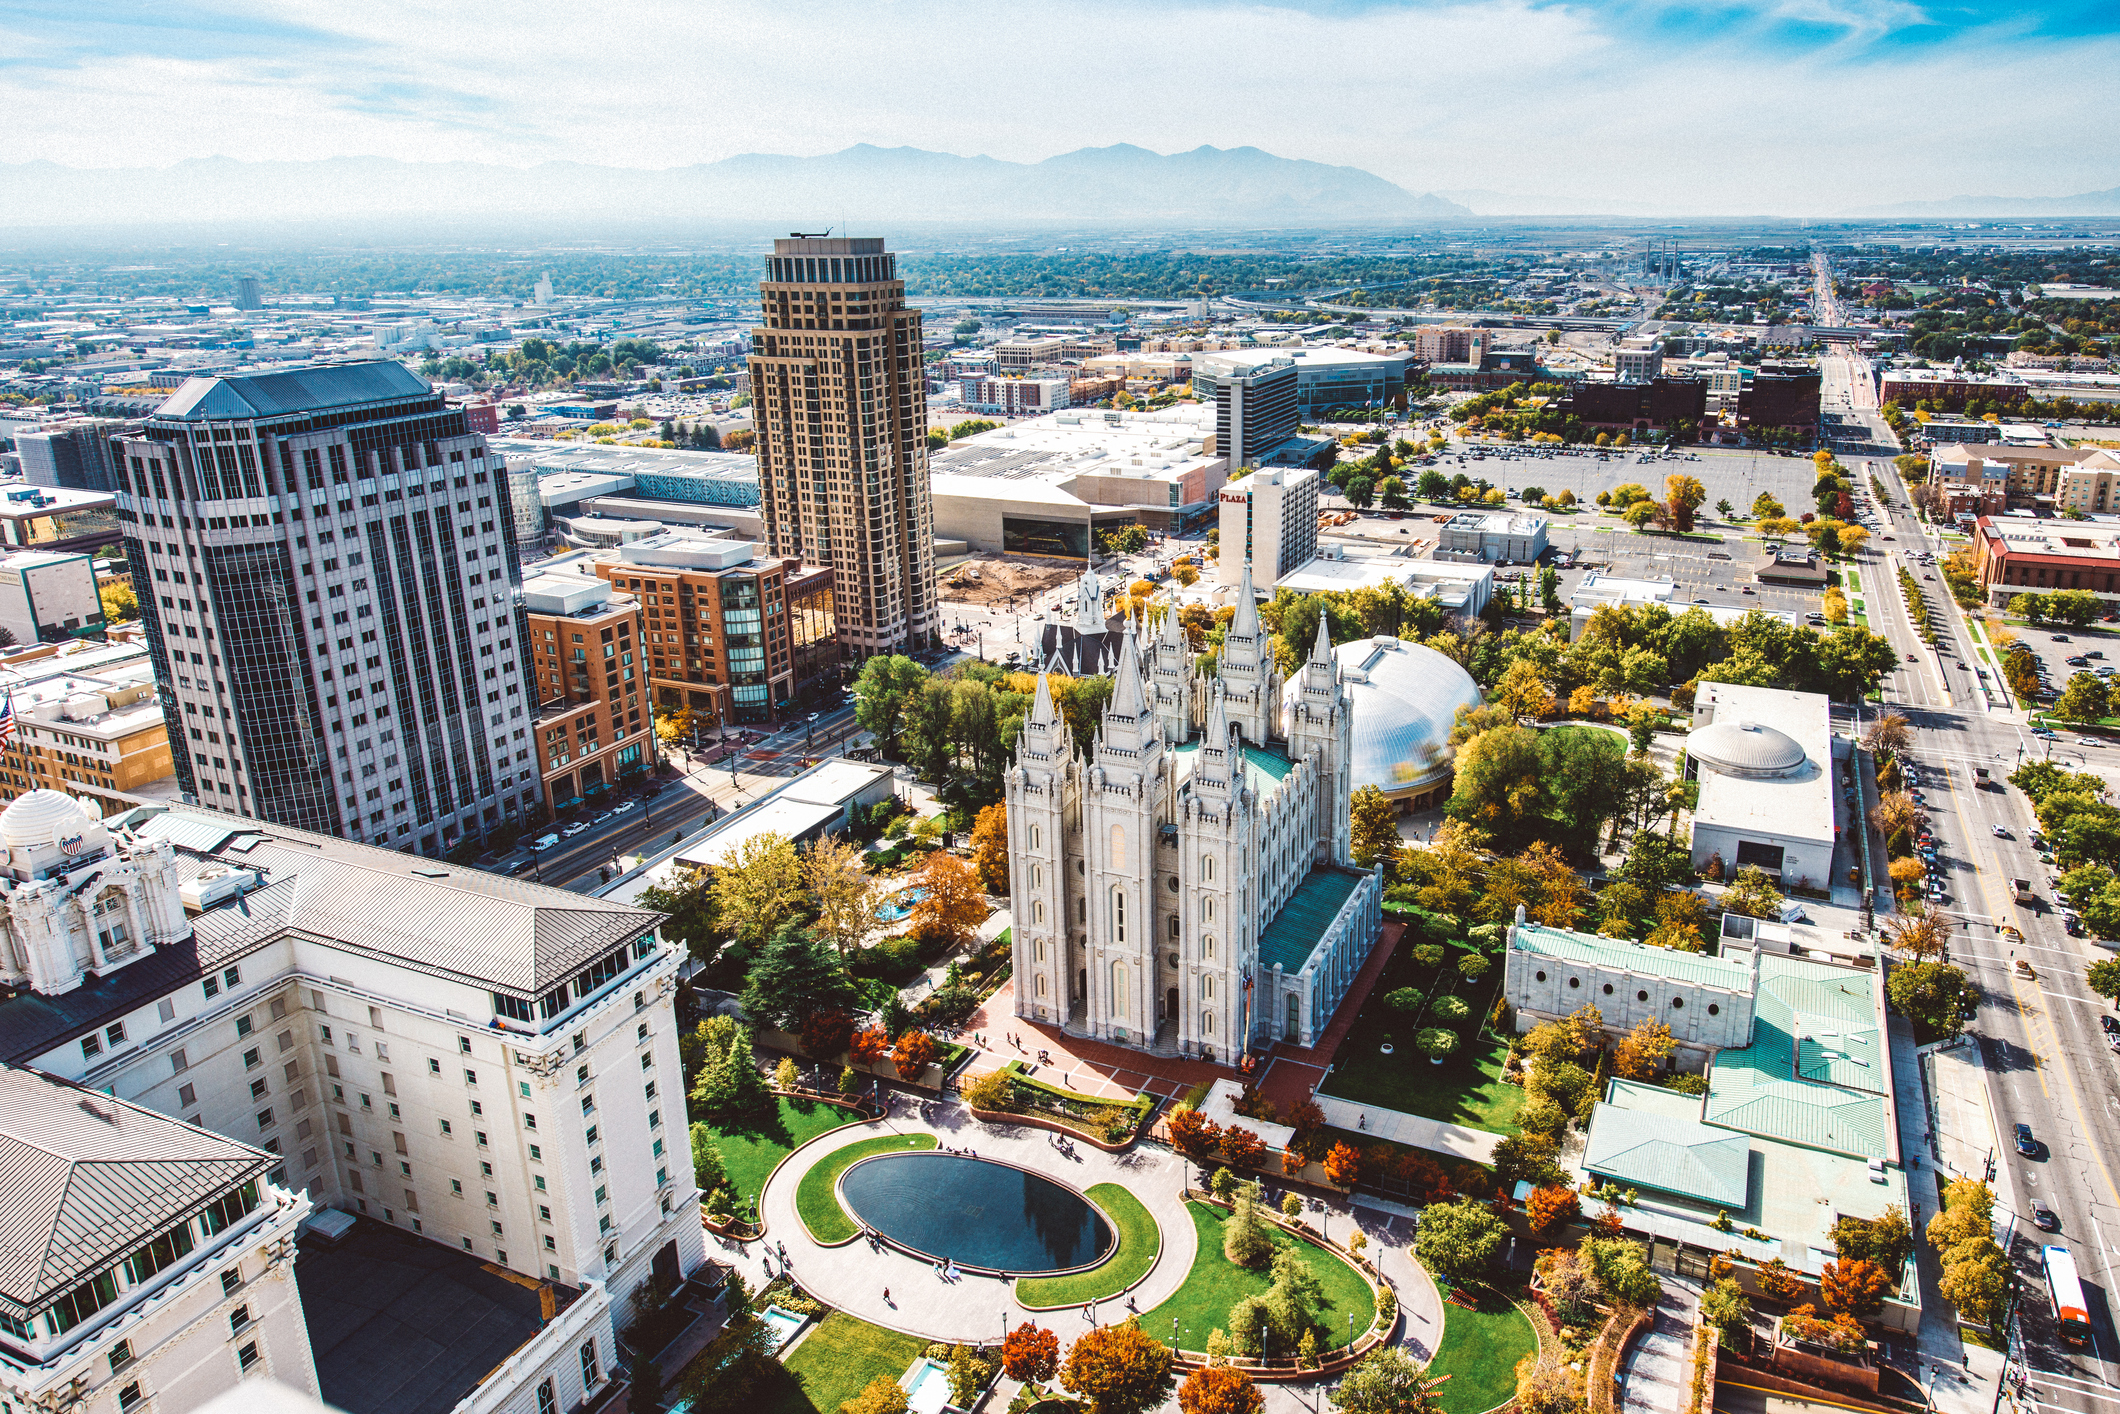
|5. Utah
The Beehive State was busy between 2015 and 2016, bumping up its jobs from 1,398,100 to 1,437,100 for a gain of 39,000 jobs. Percentagewise, that amounts to 2.8 percent overall and 3.2 percent in the private sector.
Utah's annual average for 2014–2015 was 3.8 percent.
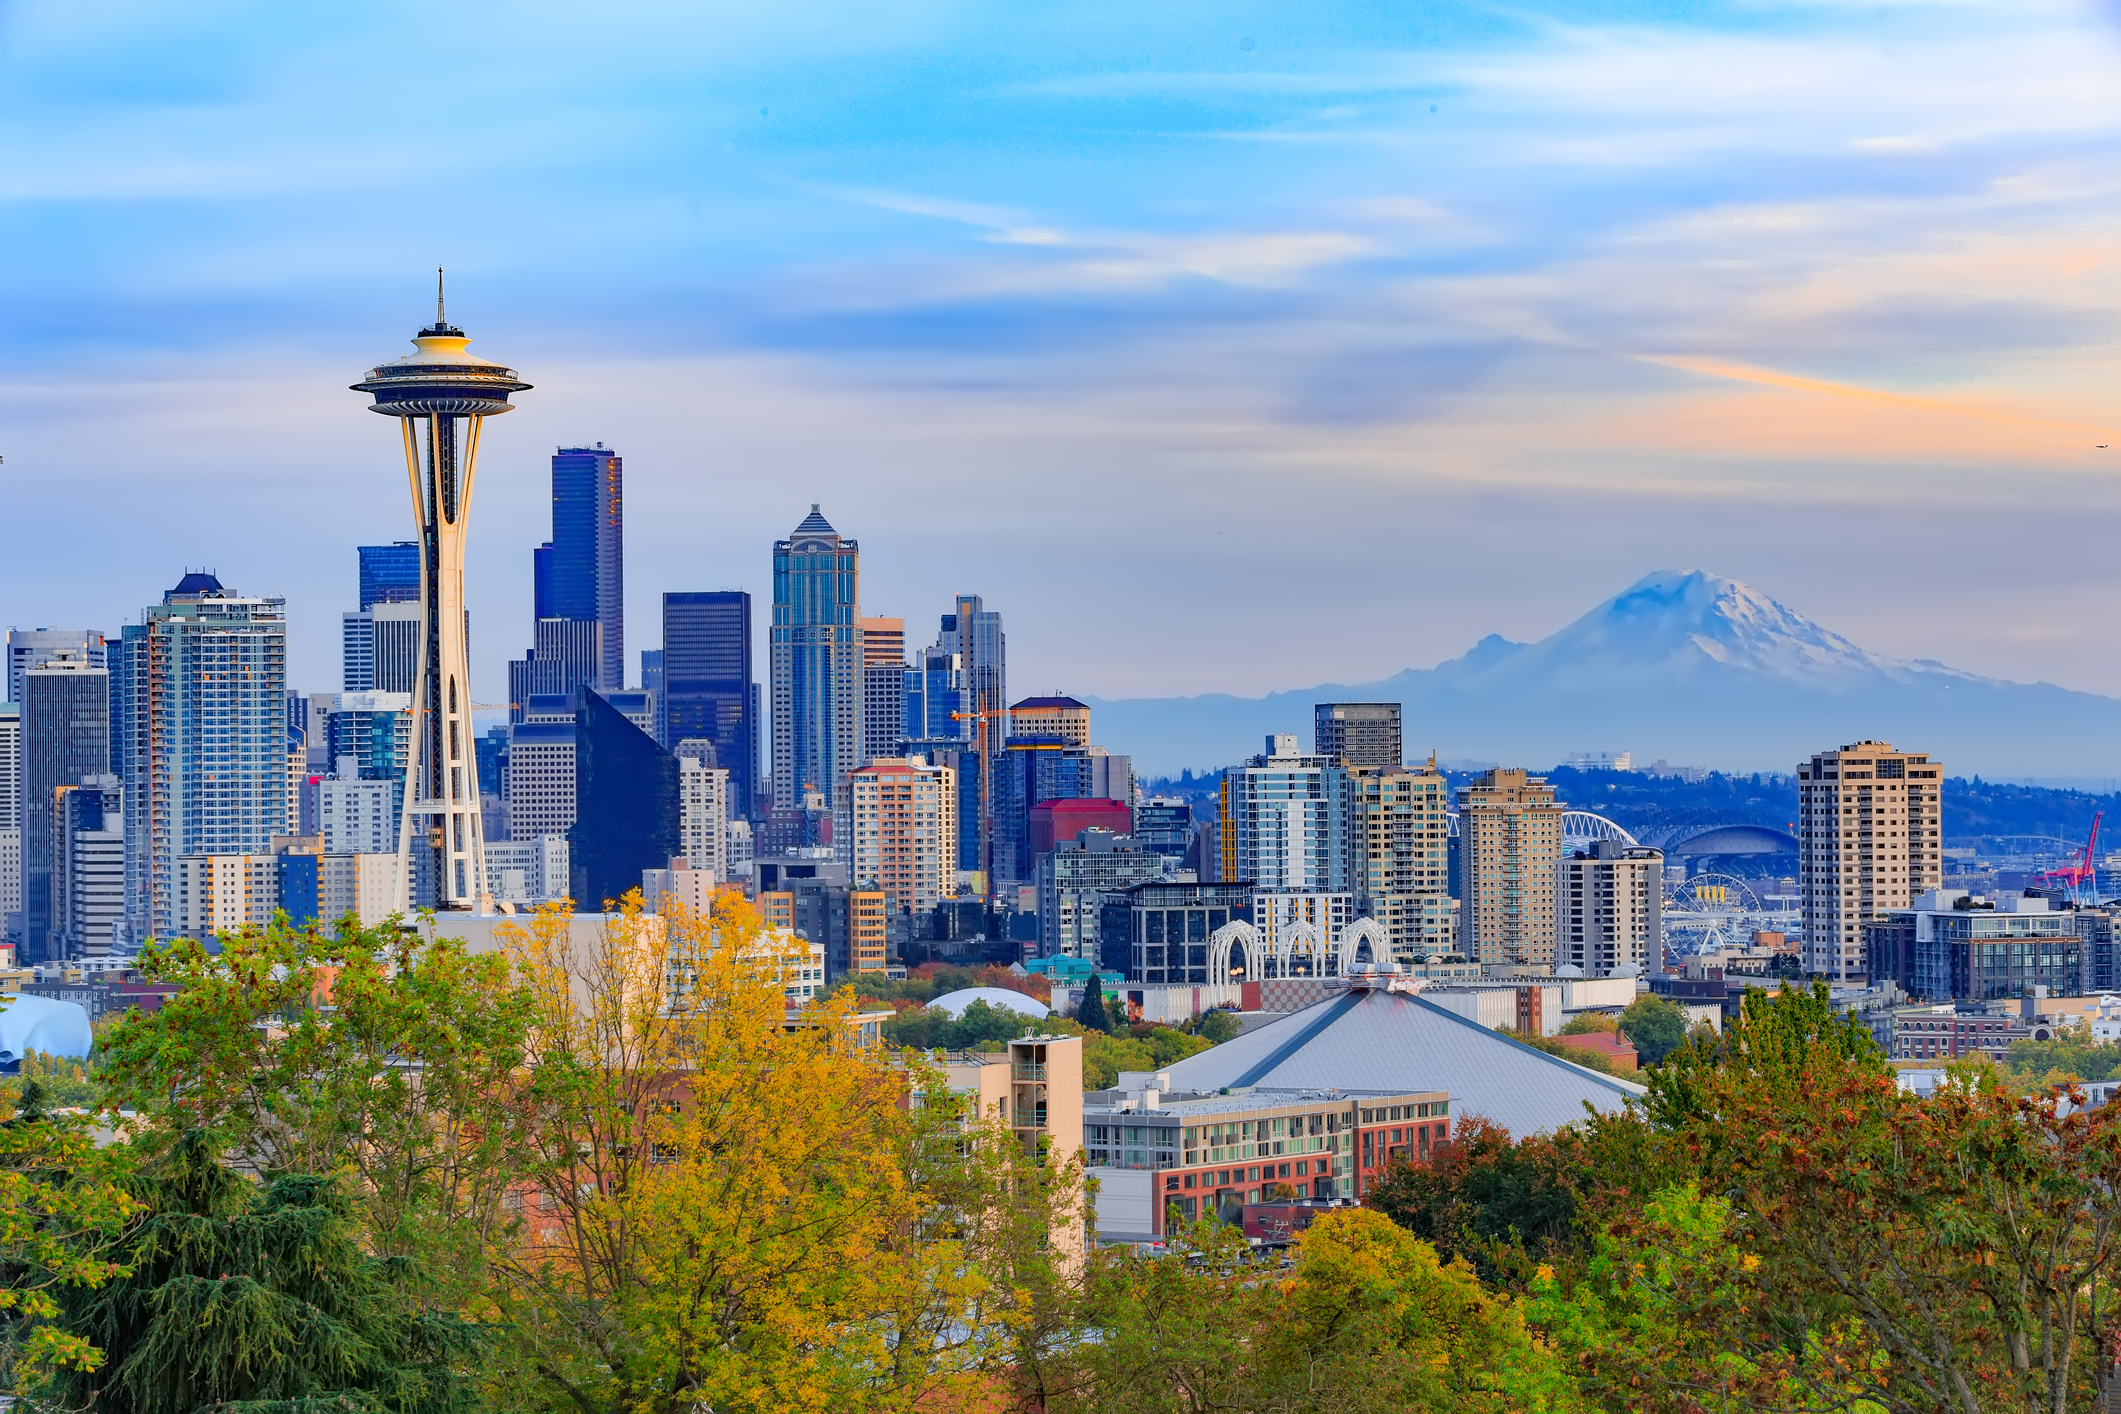
|4. Washington
Washington, which added a hefty 97,400 jobs between 2015 and 2016, grew at a rate of 3 percent, with its private sector growing at 3.2 percent. At the end of 2015, it had 3,195,300 jobs; by the end of 2016, that had grown to 3,292,700.
Washington's annual average for 2014–2015 was 2.9 percent.
|3. Nevada
Nevada's jobs market grew by 3 percent, with its private sector gaining 3.2 percent. The increase between 2015 and 2016 of 38,300 jobs, from 1,267,700 to 1,306,000, “benefited from a construction sector that registered among the strongest gains of any industry in the state,” the report said. In addition, tourism has helped the economy, with the Las Vegas Convention and Visitors Authority reporting total visitor volume up 1.5 percent for the year, along with greater increases in gaming revenues.
Nevada's annual average for 2014–2015 was 3.3 percent.
|2. Florida
The Sunshine State did well in the year between December 2015 and December 2016, boosting its workforce by 3.1 percent; its private sector's jobs increased by 3.3 percent. Going from 8,211,500 jobs to 8,462,900 added a total of 251,400 jobs. The state gained from a boost in tourism and population growth, while a recent University of Florida survey found consumer sentiment among residents had reached its second-highest level in more than 10 years.
Florida's annual average for 2014–2015 was 3.4 percent.
|1. Oregon
Oregon chalked up the largest gain, percentagewise, adding 3.3 percent to its workforce but recording a gain of 3.4 percent in its private sector. Going from 2015's 1,803,700 jobs to 2016's 1,863,100 netted it an increase of 59,400 jobs.
Oregon's annual average for 2014–2015 was 3.3 percent.
Complete your profile to continue reading and get FREE access to BenefitsPRO, part of your ALM digital membership.
Your access to unlimited BenefitsPRO content isn’t changing.
Once you are an ALM digital member, you’ll receive:
- Breaking benefits news and analysis, on-site and via our newsletters and custom alerts
- Educational webcasts, white papers, and ebooks from industry thought leaders
- Critical converage of the property casualty insurance and financial advisory markets on our other ALM sites, PropertyCasualty360 and ThinkAdvisor
Already have an account? Sign In Now
© 2024 ALM Global, LLC, All Rights Reserved. Request academic re-use from www.copyright.com. All other uses, submit a request to [email protected]. For more information visit Asset & Logo Licensing.


