Younger workers are taking over the jobs market in many cities.
At least it can seem that way, according to a CareerBuilder study on which cities are gaining—and losing—the most millennials, and which have the most rapidly aging workforce.
Young people looking for work in their chosen fields—or, sometimes, for any work at all—are increasingly gravitating toward some cities while leaving others behind.
That could be due to the job market, affordable housing or a host of other reasons.
This young workforce often brings with them the latest in training and education, but younger workers may lack basic knowledge in other areas. Employers who are shedding older workers in an effort to save money on salaries and benefits are losing a valuable opportunity to take advantage of older workers' experience.
If employers are hanging onto older workers but relegating them to lower-paying jobs and otherwise impeding their efforts to fully retire, they're only making it harder to build a younger workforce.
That's because workers stuck in lower-paying jobs often fail to make enough money to set anything aside for retirement—and thus are likely to remain in the workforce as long as they are physically capable of doing so.
Employers who offer a retirement plan, even—and perhaps especially—to younger workers can ensure that when they are ready to leave the workforce, employees will be financially prepared to do so.
Such an action could also ensure that an influx of suitable young candidates will continue to be available as the years pass.
“Whether they are motivated by financial reasons or personal choice, p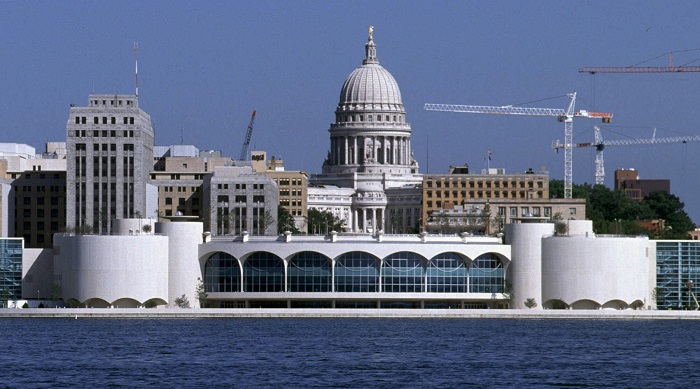 eople are staying in the workforce longer,” Matt Ferguson, chief executive officer of CareerBuilder, said in a statement.
Ferguson added, “At some point those workers and their intellectual capital will retire, so a city with a workforce that is aging at a faster rate needs to ensure it is attracting an adequate supply of new talent to fill the gap and fuel economic growth. While big cities have broad appeal, younger generations are also gravitating toward second-tier markets with diverse economies, a strong technology presence and affordable cost of living.”
And while below we offer the 10 cities where millennials are seeking their fortunes, it’s also interesting to note which cities are losing millennials at the fastest rate—meaning that businesses might be disadvantaged in the future when they seek to replace retiring workers and have a smaller pool of candidates to draw on.
Cities experiencing the biggest declines in millennial workers since 2011 include Tucson, Arizona; San Diego, California; and Toledo, Ohio.
None of the 10 most populous cities experienced a decline during this period.
And interestingly, while San Diego has a high concentration of younger workers, it’s also among the cities that have experienced the greatest exodus of millennials from its workforce since 2011—rather like a revolving door.
Whether the workers in your city are young, old, or a fortunate blend of the two, here’s a look at the cities whose workforces are gaining the most millennials.
|
10. San Jose-Sunnyvale-Santa Clara, California
Total Population in 2016: 2,001,817
Share of Workers Ages 22-34 in 2016: 27.0 percent
Change in Share of 22-34 Workers, 2001–2016: 1.4 percent
|
9. Nashville-Davidson--Murfreesboro--Franklin, Tennessee
Total Population in 2016: 1,858,130
Share of Workers Ages 22-34 in 2016: 29.9 percent
Change in Share of 22-34 Workers, 2001–2016: 1.5 percent
|
8. Urban Honolulu*, Hawaii
Total Population in 2016: 1,006,973
Share of Workers Ages 22-34 in 2016: 30.8 percent
Change in Share of 22-34 Workers, 2001–2016: 1.5 percent
* The Census Bureau's Honolulu Census Designated Place (CDP) was separated in 2010 into 3 areas: Urban Honolulu CDP, East Honolulu CDP, and a portion placed in the already existing Hickam CDP.
|7. Richmond, Virginia
Total Population in 2016: 1,283,671
Share of Workers Ages 22-34 in 2016: 28.3 percent
Change in Share of 22-34 Workers, 2001–2016: 1.5 percent
|
6. Augusta-Richmond County, Georgia/South Carolina
Total Population in 2016: 594,377
Share of Workers Ages 22-34 in 2016: 30.0 percent
Change in Share of 22-34 Workers, 2001–2016: 1.6 percent
|
5. Austin-Round Rock, Texas
Total Population in 2016: 2,051,270
Share of Workers Ages 22-34 in 2016: 32.3 percent
Change in Share of 22-34 Workers, 2001–2016: 1.6 percent
|
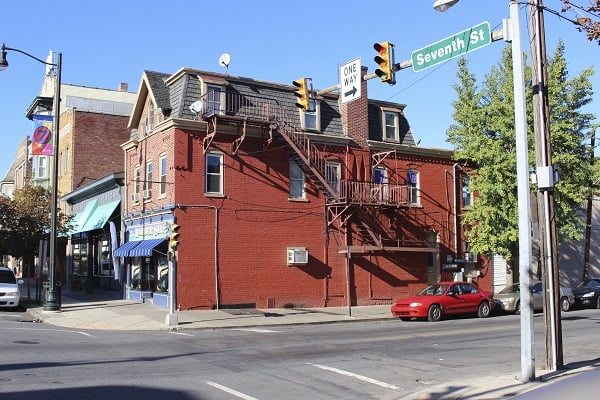
4. Allentown-Bethlehem-Easton, Pennsylvania/New Jersey
Total Population in 2016: 835,117
Share of Workers Ages 22-34 in 2016: 26.2 percent
Change in Share of 22-34 Workers, 2001–2016: 1.7 percent
|
3. Colorado Springs, Colorado
Total Population in 2016: 707,073
Share of Workers Ages 22-34 in 2016: 31.6 percent
Change in Share of 22-34 Workers, 2001–2016: 2.0 percent
|
2. El Paso, Texas
Total Population in 2016: 847,282
Share of Workers Ages 22-34 in 2016: 32.3 percent
Change in Share of 22-34 Workers, 2001–2016: 2.1 percent
|
1. Madison, Wisconsin
Total Population in 2016: 647,860
Share of Workers Ages 22-34 in 2016: 30.3 percent
Change in Share of 22-34 Workers, 2001–2016: 3.1 percent
While Madison has experienced the greatest increase in the share of workers ages 22-34 from 2001 to 2016, Provo, Utah has the highest overall share of millennial workers; 35.4 percent of its workforce was aged 22–34 in 2016, roughly the same as in 2001 and 2011.
Other top-ranking cities with the greatest overall share of millennial workers include El Paso, Texas (32.3 percent), Austin, Texas (32.3 percent), Salt Lake City, Utah (32.2 percent) and San Diego, California (31.9 percent).
Among the 10 most populous cities, San Francisco, California, New York, New York and Atlanta, Georgia saw the biggest increase in millennials since 2011.
Complete your profile to continue reading and get FREE access to BenefitsPRO, part of your ALM digital membership.
Your access to unlimited BenefitsPRO content isn’t changing.
Once you are an ALM digital member, you’ll receive:
- Breaking benefits news and analysis, on-site and via our newsletters and custom alerts
- Educational webcasts, white papers, and ebooks from industry thought leaders
- Critical converage of the property casualty insurance and financial advisory markets on our other ALM sites, PropertyCasualty360 and ThinkAdvisor
Already have an account? Sign In Now
© 2024 ALM Global, LLC, All Rights Reserved. Request academic re-use from www.copyright.com. All other uses, submit a request to [email protected]. For more information visit Asset & Logo Licensing.


