
COVID-19 may not have done much to workers' blood pressure.
About 25.5% of the working-age Americans in a typical state reported in 2023 that they had high blood pressure, which is also known as hypertension.
The median was up, slightly, from about 25.3% in 2019, before the COVID-19 pandemic appeared, according to new data from the U.S. Centers for Disease Control and Prevention's Behavioral Risk Factor Surveillance System survey program.
Recommended For You
High blood pressure made people more vulnerable to COVID-19.
Some epidemiologists suggested that the pandemic could increase people's blood pressure, by damaging people's blood vessels.
The new, relatively low blood pressure figures could be a sign that speculation was incorrect.
It's also possible that awareness of hypertension is falling because, due to the impact of the pandemic, fewer people are getting basic primary care.
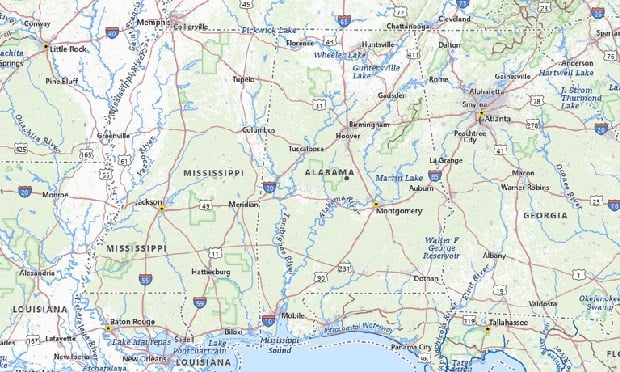
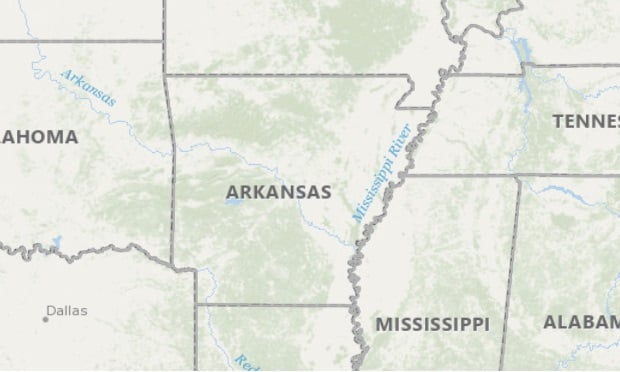
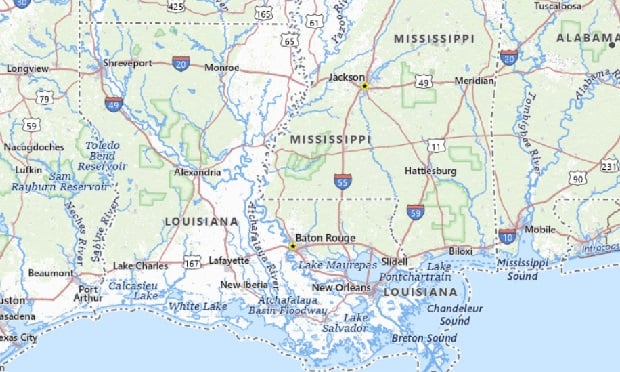
At the state level, reported hypertension levels ranged from less than 23%, in Wyoming, up to more than 25%, in two states.
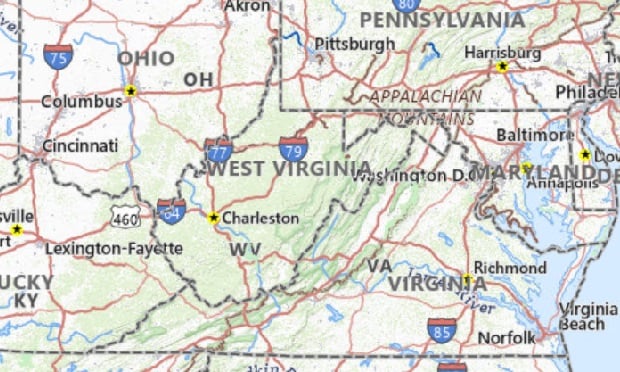
For a look at the five states with the highest high blood pressure rates for working-age adults, see the gallery above.
For data for all 50 states, the District of Columbia and Puerto Rico, see the table below.
Methods: The CDC breaks blood pressure data down for people under 18, people ages 65 and older, and four age groups from 18 through 64.
We came up with a high blood pressure prevalence rate for the working-age population by averaging the data for the age groups in that age range.
One benefit of using that approach is that it filters out the effects of the aging of the population, or other population trends, in a given state.
At press time, the CDC had not included data from Kentucky and Pennsylvania in the 2023 BRFSS results.
The impact: About half of all U.S. adults have high blood pressure, and high blood pressure caused or contributed to 685,875 deaths in 2022, according to the U.S. Centers for Disease Control and Prevention.
High blood pressure hits the United States with about $68 billion in direct medical costs per year, and it causes about $42 billion per year in indirect costs, through effects such as lost productivity, the American Heart Association reports.
A team led by a CDC research reported in 2022, based on an analysis of existing research, that the cost of hypertension-related absenteeism and presenteeism could be $2,362 per affected employee per year.
| Adults Ages 18-64 With High Blood Pressure | |||
| 2019 | 2023 | Change, in percentage points | |
| Alabama | 33.30% | 34.80% | +1.50 |
| Alaska | 31.60% | 27.82% | -3.78 |
| Arizona | 24.54% | 24.30% | -0.24 |
| Arkansas | 33.02% | 33.58% | +0.56 |
| California | 21.10% | 23.28% | +2.18 |
| Colorado | 19.32% | 20.76% | +1.44 |
| Connecticut | 21.58% | 22.94% | +1.36 |
| Delaware | 26.98% | 32.18% | +5.20 |
| District of Columbia | 27.38% | 28.58% | +1.20 |
| Florida | 23.22% | 24.12% | +0.90 |
| Georgia | 27.16% | 26.68% | -0.48 |
| Hawaii | 22.44% | 23.34% | +0.90 |
| Idaho | 23.12% | 23.00% | -0.12 |
| Illinois | 23.18% | 25.12% | +1.94 |
| Indiana | 26.42% | 28.34% | +1.92 |
| Iowa | 23.36% | 25.54% | +2.18 |
| Kansas | 25.74% | 26.04% | +0.30 |
| Kentucky | 32.06% | NA | - |
| Louisiana | 31.60% | 33.88% | +2.28 |
| Maine | 25.84% | 24.20% | -1.64 |
| Maryland | 25.26% | 26.44% | +1.18 |
| Massachusetts | 19.54% | 22.14% | +2.60 |
| Michigan | 26.42% | 27.18% | +0.76 |
| Minnesota | 20.38% | 22.24% | +1.86 |
| Mississippi | 35.10% | 36.84% | +1.74 |
| Missouri | 22.70% | 26.62% | +3.92 |
| Montana | 20.44% | 23.18% | +2.74 |
| Nebraska | 23.02% | 24.70% | +1.68 |
| Nevada | 25.42% | 26.76% | +1.34 |
| New Hampshire | 21.92% | 26.23% | +4.31 |
| New Jersey | NA | 24.04% | - |
| New Mexico | 22.98% | 29.75% | +6.77 |
| New York | 21.24% | 23.10% | +1.86 |
| North Carolina | 26.44% | 28.12% | +1.68 |
| North Dakota | 21.80% | 24.50% | +2.70 |
| Ohio | 26.38% | 27.44% | +1.06 |
| Oklahoma | 29.24% | 30.16% | +0.92 |
| Oregon | 22.04% | 24.74% | +2.70 |
| Pennsylvania | 23.26% | NA | - |
| Puerto Rico | 30.92% | 31.66% | +0.74 |
| Rhode Island | 24.24% | 24.10% | -0.14 |
| South Carolina | 28.60% | 27.70% | -0.90 |
| South Dakota | 26.45% | 25.38% | -1.07 |
| Tennessee | 30.64% | 31.08% | +0.44 |
| Texas | 25.14% | 25.26% | +0.12 |
| Utah | 21.42% | 23.08% | +1.66 |
| Vermont | 25.55% | 22.82% | -2.73 |
| Virginia | 25.26% | 26.74% | +1.48 |
| Washington | 22.80% | 22.84% | +0.04 |
| West Virginia | 33.06% | 33.38% | +0.32 |
| Wisconsin | 25.63% | 23.58% | -2.05 |
| Wyoming | 22.28% | 22.04% | -0.24 |
| MEDIAN | 25.26% | 25.46% | +0.20 |
© Touchpoint Markets, All Rights Reserved. Request academic re-use from www.copyright.com. All other uses, submit a request to [email protected]. For more inforrmation visit Asset & Logo Licensing.
Allison Bell

Allison Bell, a senior reporter at ThinkAdvisor and BenefitsPRO, previously was an associate editor at National Underwriter Life & Health. She has a bachelor's degree in economics from Washington University in St. Louis and a master's degree in journalism from the Medill School of Journalism at Northwestern University. She can be reached through X at @Think_Allison.


